Market Snapshot: The pulp and paper sector uses less energy and produces less material than it did 20 years ago
Connect/Contact Us
Please send comments, questions, or suggestions for Market Snapshot topics to snapshots@cer-rec.gc.ca
Release date: 2019-11-20
Over the past two decades, energy demand and production from Canada’s pulp and paper industry has fallen significantly. In 1997, annual energy demand from the pulp and paper industry totaled almost 415 petajoules (PJ). This made pulp and paper the number one industrial energy user in Canada at 20% of all industrial energy demand. By 2017, pulp and paper’s energy demand had fallen to about 231 PJ and only 8% of all industrial energy demand.
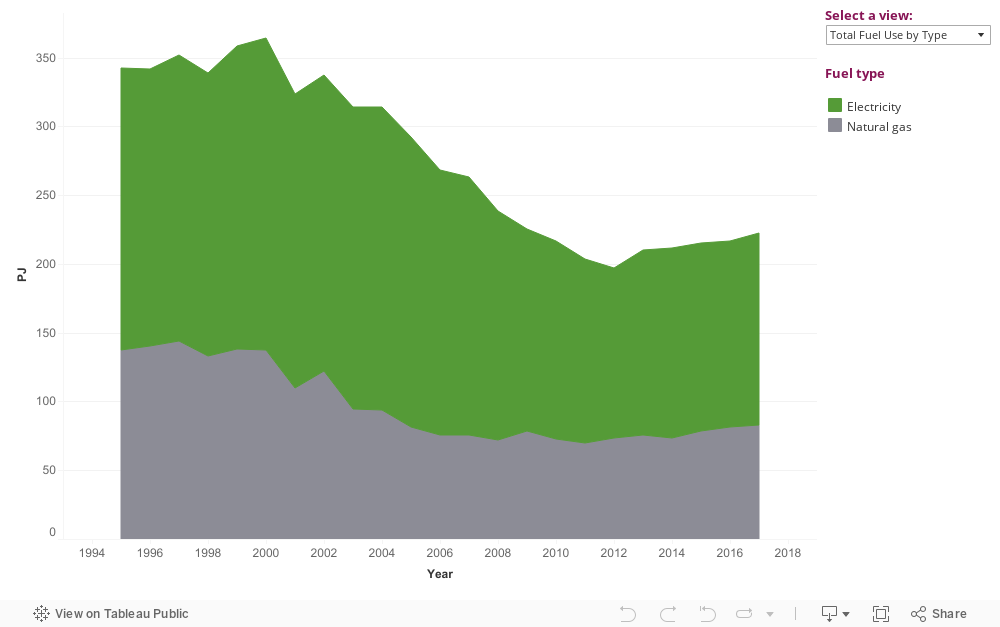
Figure 1. Energy use by fuel type in the pulp and paper industry (1995-2017)
Source and Description
Source: Statistics Canada Table 36-10-0434-06
Description: This graph shows energy demand for the pulp and paper industry in PJ. Total energy demand for all fuel types is shown, as well as the breakdown between demand for natural gas and electricity. From 1997 to 2017 total fuel demand fell from 415 PJ to 231 PJ; a 44% decrease.
Natural gas and electricity are the two most important fuels used in the pulp and paper industry. Electricity powers machinery while natural gas produces the steam and hot air required by the manufacturing process. A large amount of electricity is generated by burning by-products created in the manufacturing process. In 2017, industrial electricity generated from the manufacturing process amounted to 9.2 TW.hFootnote 1 or 33 PJ, which is about 24% of the sector’s total electricity demand.
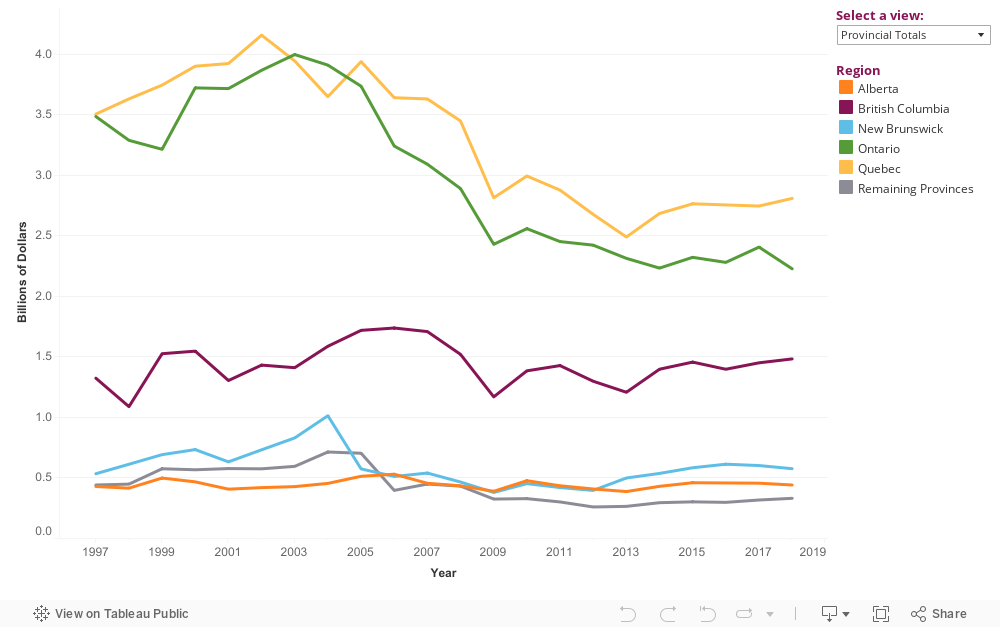
The pulp and paper industry has a large presence in several provinces but is largest in Quebec, Ontario, and British Columbia. The industry’s economic output in Canada peaked in 2004 at $11.3 billion. By 2018 output fell to $7.8 billion; a decline of 45%. Provincial outputs show a similar, downward trend.
Figure 2. Economic output of the pulp and paper industry for all of Canada and by province (1997–2018)
Source and Description
Source: Statistics Canada Table 25-10-0029-01
Description: This line graph shows the output in billions of dollars for the pulp and paper industry. Both the total output for Canada and provincial outputs are shown. The other provinces category includes Manitoba, Saskatchewan, Nova Scotia, Prince Edward Island and Newfoundland and Labrador. From 2004 to 2017, total output fell from $11.3 billion to $7.8 billion, a nearly 45% drop.
This lower economic output can be attributed to lower demand for printing and writing paper, and increased competition from other parts of the world. The production of newsprint and writing paper in Canada fell from 7 and 6 million tonnes in 2007, respectively, to 3 million tonnes for both types of paper in 2017.Footnote 2 Similarly, pulp production fell from 22 million tonnes to 6 million tonnes over the same time.
- Date modified: