Backgrounder - Briefing Binder for CER Appearance at the House of Commons Standing Committee on Natural Resources
Background - Toll and Tariff Hearings (why an interim hearing, typical rhythm)
Why is the hearing about interim tolls? When will final tolls be set?
- By way of background, the difference between interim and final tolls is that interim tolls can be changed retroactively. In Trans Mountain’s case, it has been charging interim tolls since TMX entered service in May. Once final tolls get approved by the Commission, Trans Mountain’s tolls can be changed retroactively back to when TMX entered service.
- Unlike the Trans Mountain interim tolls application, typical interim tolls applications are neither complex nor contentious. Accordingly, they are usually dealt with as quick and routine matters.
- However, the Commission decided that a hearing was needed to deal with Trans Mountain’s interim tolls application, given a few factors that made it distinct from prior interim tolls applications.
- Partly, this was owing to the large jump in costs and tolls, and also the degree of concern in comments submitted after the application was filed.
- Another key factor was that under Trans Mountain’s negotiated toll methodology, interim tolls would be charged for an extended period. Even without the Commission holding a hearing on the interim tolls application, it would likely be over a year after TMX commenced service before Trans Mountain would be ready to apply for approval of final tolls.
- Normally, Commission decisions on interim tolls are in no way rulings on the merits of any subsequent final tolls applications. In the Trans Mountain interim tolls hearing, however, the Commission has made it clear that it intends to issue final determinations on as many issues as possible. As a result, the Commission expects that final tolls will be determined in accordance with the decision that will be issued in the interim tolls hearing.
- The process and timing for approving final tolls will depend partly on the Commission’s decision in the current hearing.
Typical rhythm for tolls and tariffs decisions? (e.g., “why is the Commission only looking at TMX tolls now that the project is complete?”)
- When large projects are proposed, it is common for the application for the toll methodology to come in with, or before, the application for the physical project.
- When and how subsequent toll applications arise and get dealt with really depends on the circumstances.
- In Trans Mountain’s case, the negotiated toll methodology for the expanded system was approved by the NEB in 2013, before the application to build TMX was filed.
- That negotiated methodology stipulated how tolls would change based on actual project costs.
- Accordingly, it stipulated that shortly before TMX entered service, Trans Mountain would apply for interim tolls based on an updated cost estimate. That has now occurred.
- The negotiated methodology also stipulated that some time after TMX entered service, and after shippers had the chance to audit the project’s as-built costs, Trans Mountain would apply for final tolls.
Background - The Regulation of GHG Emissions
The CER does not directly regulate GHG emissions, rather it regulates the infrastructure itself; releases of methane and other GHG emissions from CER-regulated facilities are subject to ECCC and provincial regulations.
Methane is regulated by ECCC as a pollutant under the Canadian Environmental Protection Act, 1999 and ECCC’s 2018 Regulations Respecting Reduction in the Release of Methane and Certain Volatile Organic Compounds (Upstream Oil and Gas Sector).
In December 2023, Environment and Climate Change Canada published Proposed Regulations Amending the Regulations Respecting Reduction in the Release of Methane and Certain Volatile Organic Compounds (Upstream Oil and Gas Sector) and the consultation period is now closed. The final regulations are expected to be published in the Canada Gazette, Part II, in late 2024.
Under the Greenhouse Gas Pollution Pricing Act, the federal carbon pollution pricing system has two parts: 1)a regulatory charge on fuel (federal fuel charge); and 2) a regulatory trading system for industry – the federal Output-Based Pricing System (OBPS). The federal OBPS is designed to ensure there is a price incentive for industrial emitters to reduce their greenhouse gas emissions and spur innovation while maintaining competitiveness and protecting against “carbon leakage”. On November 22, 2023, the Regulations Amending the Output-Based Pricing System Regulations and the Environmental Violations Administrative Monetary Penalties Regulations were published in the Canada Gazette, Part II. These amendments ensure continued greenhouse gas (GHG) emissions reductions, reduce the administrative burden, and improve the implementation of the OBPS Regulations. The OBPS establishes that persons responsible for covered facilities are required to compensate for the GHG emissions that exceed a facility’s annual limit. The annual limits are outlined in the Output-Based Pricing System Regulations, which came into force in part in 2019, and in full by 2022.
The facility definition of these regulations includes transmission pipelines and associated compression facilities (not used for local distribution). Schedule 1 sets a limit for the transmission of processed natural gas as 0.393 Co2e tonnes per Megawatt hour (MWh) compression. ECCC is currently working to establish the offset protocols to create the credits required when facilities emit over their designated limit.
Different (equal or more stringent) thresholds exist provincially for transmission lines and compression facilities where the OBPS backstop is not needed (BC, AB, ON, QC, NB, NS, NL and NWT).
Other regulations which are not focused on methane, but do contribute to GHG management include ECCC Multi-Sector Air Pollutant Regulations (SOR/2-16-151) (MSAPR), which includes NOx emission intensity limits. Maintaining low-NOx units also reduces GHG emissions, as the oxides of nitrogen can react in the atmosphere to contribute to N2O concentrations
CER Consideration of GHG emissions and Reductions in Project Hearings
Both the CER Act and the Impact Assessment Act have a factor to consider “the extent to which [the effects] hinder or contribute to the Government of Canada’s …commitments in respect of climate change”. To support the assessment of this factor, ECCC released its Strategic Assessment of Climate Change (SACC) which outlines the types of information proponents are required to file as well how the information may be considered. Key points in the SACC include the requirement for proponents to include a credible plan to achieve netzero emissions by 2050, and establishes a decreasing threshold for an assessment of upstream emissions (currently required for projects over 500 kt CO2e/yr, decreasing to 100 kt CO2e/yr by 2050). The CER’s Filing Manual was updated in May 2023 to reflect the requirements set out in SACC and associated Technical Guides, and also to provide guidance on the climate change factor.
Background - Methane Regulations (Regulatory amendment for a 75% reduction by 2030)
How the policy was assumed and applied in EF2023
Prior to the release of EF2023, we were aware of Canada’s commitment to reduce methane emissions from oil and gas operations, by at least 75% by 2030, relative to 2012. This increase in stringency was incremental to the regulations already in place (2016) aim to reduce methane emissions from the sector by 40-45% by 2025. However, the regulations to achieve the 75% reduction were not available until after the publication of EF2023 (they were published to CG1 in December 2023).
As such, the original regulations were included in all scenarios, whereas the 75% reduction was included only the GNZ and CNZ scenarios.
To model emissions from the sector, we assumed the reductions contemplated by the regulations through adoption of new methane control technologies or process change. To understand the impact of the regulations on conventional oil and natural gas production, we estimated a methane abatement cost curve (i.e., $/Mcf) based on work done by the IEA for Canada and work that into those supply models by subtracting the cost from revenues. This cost affected the production projections through lowering the capital available for future reinvestment. Some mitigation of methane emissions can actually be a net benefit to producers, with the gas captured available to be sold, resulting in higher revenue. After those opportunities are realized, the cost of implementing new processes and technologies grows from very inexpensive to very substantial for the hardest to mitigate emission. Much of the methane abatement curve is below $0/MMBtu when you consider that the conserved gas can then be sold, but is over $2/MMBtu for the more costly reductions."
Latest policy developments
In December 2023, the federal government published draft regulations amending the existing methane regulations for the oil and gas sector.
The original methane regulations were published in 2018. Since then, Canada signed on to the Global Methane Pledge which aims to reduce global anthropogenic methane emissions across all sectors by at least 30% by 2030, relative to 2020. Canada has also committed to further reduce methane emissions from oil and gas operations, by at least 75% by 2030, relative to 2012.
The methane regulations apply to upstream, midstream, and transmission oil and gas facilities in Canada’s onshore oil and gas sector.
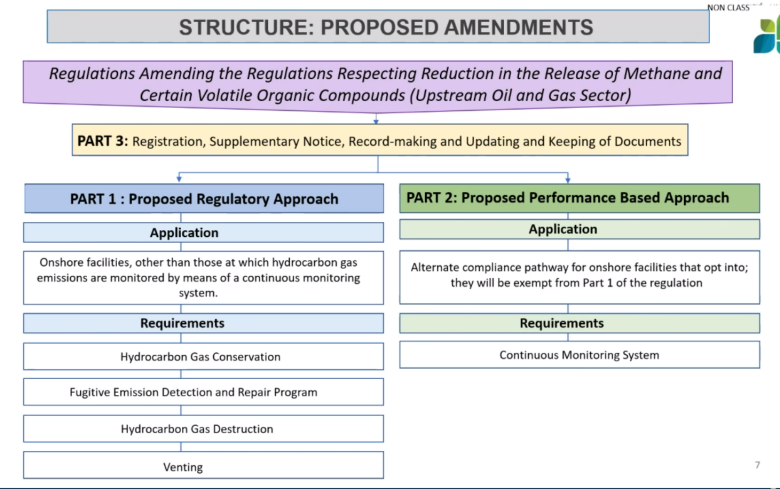
The amendments introduce a new performance-based compliance option designed to focus on emission outcomes, rather than prescribing a specific pathway to compliance. Facilities that opt into Part 2, the use of a Continuous Monitoring System, are exempt from Part 1 of the Regulation (which includes more specific technological and process standards). Upon detection of methane emissions, a mitigation response must be initiated, with timelines dictated by emission rate.
ECCC will once again welcome the signing of equivalency agreements as allowed under CEPA.
The government proposes that the new regulations come into force either 2027 or 2030, depending on the facility and measure.
Comparing EF2023 policy assumptions to the proposed regulations
The proposed amendment to the regulations provides much greater detail of compliance options. We are working on modeling improvements to better reflect methane abatement activities as part of the development of new conventional oil and natural gas production models.
Background - Oil and Gas Emissions Cap
How the policy was assumed and applied in EF2023
Prior to the release of EF2023, the Government of Canada had released few details on their proposed emissions cap for the oil-and-gas sector. Even the government’s discussion paper on the cap, which proposed sector-specific carbon pricing versus a cap-and-trade system, was non-specific and did not include many details on how it might be implemented. Thus, we had to decide how to model the cap in a way that would achieve publicly announced targets of 1) a 30% reduction in emissions from the oil and gas sector by 2030 when compared to 2005 levels, as announced in the government’s 2030 Emissions Reduction Plan (ERP), and 2) how the upstream oil-and-gas sector might reach net-zero emissions by 2050.
In the end, we chose sector-specific carbon pricing. A lot of this was practical: the oil sands model, prior to being updated to include the proposed cap, used Canada’s existing policy of carbon pricing, so the model did not require much changing. Further, it allowed us to more directly compare carbon pricing we applied in the oil-and-gas sector to carbon pricing we applied for the rest of the economy. We could also say that the carbon policies we applied were more coherent across EF2023, because they were more similar.
Our assumed carbon pricing for the oil-and-gas sector used an industrial output-based pricing system (OBPS) similar to Canada’s industrial carbon pricing. This applies a carbon price to emissions, but also generates credits based on the sector’s per barrel emissions, where the amount of credits declines over time as the policy becomes tighter. Eventually, when OBPS falls to 0%, all polluters pay the full carbon price.
For example, if the average emissions intensity of in situ oil sands projects was 0.07 tonnes of CO2e per barrel (tCO2e/bbl) of bitumen produced in 2022, and the OBPS covered 80% of emissions for that year, then 0.056 tCO2e/bbl of credits would be awarded to facilities. Any facilities that had emissions intensities below that benchmark would not only pay no carbon cost, but could also sell excess credits to facilities above the benchmark. Facilities with emissions intensities above the benchmark would need to pay for their excess emissions, either though buying credits from facilities below the benchmark or by paying the emissions price (e.g., $50/tCO2e in 2022). We assumed credits traded for the emissions price.
For conventional oil-and-gas, which is not modeled project-by-project but is based on of typical wells based on location and geology, we simply applied a carbon fee to fuel used, where the fee was based on the carbon price but the OBPS was applied to it to determine a net carbon cost.
Using this system, we incrementally increased the carbon price and decreased the OBPS (to 0% in GNZ and 24% in CNZ) until the emissions target was met across the upstream oil-and-gas sector, where any remaining emissions in 2050 below 25 MT per year could be offset through negative emissions elsewhere. We assumed it would apply to the upstream only, and that transmission pipelines, LNG facilities, and refineries would be regulated using Canada’s current industrial carbon pricing. Finally, while we applied a carbon price to the upstream oil-and-gas sector, a cap-and-trade system would be modeled in a similar way and would have yielded similar results. Both end up with some form of carbon cost applied, where the cost under a carbon levy is set by governments while the cost under a cap-and-trade system is determined by markets.
Latest policy developments
On December 7th, 2023, the Government of Canada released their proposed regulatory framework outlining how they plan to implement a cap on GHG emissions from the oil and gas sector. The government has decided to implement a cap-and-trade system that will be layered on top of existing industrial emissions policies, where tradeable credits will initially be issued for free. The cap would decrease allowable emissions from the upstream oil and gas sector to 35% to 38% below 2019 emissions levels (or 106 to 112 MT CO2e by 2030 and to net-zero by 2050), though direct emission reductions could be as little 20 to 23% by 2030, because emitters would be allowed to use up to 25 MT of offsets (equal to 20% of their total emissions). The Canada Net-zero oil and gas production outlook from EF2023 was used to develop an upper bound for emissions from the sector in 2030, which is a critical part of the framework. This speaks to the confidence federal partners have in our work.
- The regulations cover upstream emissions and LNG. The regulations are designed to cover emissions from the upstream oil and gas sector. On the conventional side of production, this covers onshore and offshore crude oil and gas production, along with gathering pipelines when they are part of a covered facility. These facilities include those that process natural gas, produce natural gas liquids, and produce liquefied natural gas. Oil sands mines and in situ producers are also included along with facilities that upgrade bitumen into synthetic crude oil. Refineries are not included. Our initial assessment of the regulations is that they will not apply to large CER regulated pipelines like the NGTL system or Trans Mountain.
- Regulations are planned to be finalized in 2025. The regulations issued in December 2023 are not final and the government is requesting feedback on their design. Final regulations are targeted to come into force in 2025, with facilities being required to register under them by January 1, 2026. From 2026 to 2030 the system would be phased in.
- The regulations allow flexibility in how the cap is met. For example, the regulations allow emitters to cover up to 20% of their total obligation with domestically verified offsets or by paying into an oil and gas emissions reduction fund. A maximum of 10% of total obligations can be covered by contributions to the fund. The government expects that this will provide a lower cost option for emitters to meet a portion of their obligation. The government is also considering whether international emissions reductions will be given credit.
Comparing EF2023 policy assumptions to the proposed regulations
In EF 2023, we included the emissions cap in the Canada Net-zero and Global Net-zero scenarios (i.e. - 31% from 2005 in 2030+2 yrs, -60% in 2040 and 25MT in 2050). As we didn’t have full information of what the regulations would look like we had to make an educated guess of what they would entail. We modeled the emissions cap using a carbon price rather than the selected cap-and-trade system, although from a modeling perspective these two policies are functionally the same. Compared to the proposed framework, EF 2023 included a more stringent cap on emissions, as we did not allow for the large offset contribution to meet 2030 targets (i.e., the 25 MT of offsets in the current proposal). Our modeling for EF 2025 will be adjusted to reflect the additional information made available about this regulation.
Background – GHG Emissions Accounting
- We use the National Inventory Report (NIR) numbers from Environment and Climate Change Canada (ECCC) for history
- For the O&G GHG emissions projections, the process is as follows:
- We estimate oil and gas production levels based on each scenario assumptions about macroeconomics, commodity prices, policy stringency (which impacts production costs), and the performance of different production technologies, geology, resources, etc.
- Production of each type requires energy – e.g., natural gas used for production of steam and electricity for in-situ oil sand production, diesel used for mining trucks, etc.
- Energy use/combustion generates GHG emissions as per commonly used emissions factors
- In addition to energy combustion, we also account for fugitive emissions associated with the production, processing, and transportation of oil and gas – including unintentional releases, flaring, and venting (these all vary by production type)
- We also account for the impact that sector-specific technologies will have on GHG emissions levels from a given sector – in the case of oil and gas this includes efficiencies in production processes, energy efficiency, and the use of carbon capture and storage (CCS)
- Overall, the process is similar across all sectors of the economy:
- We have macroeconomic drivers (like GDP, population growth, household formation, prices, etc.) that result in a given level of economic activity across a sector.
- That activity requires energy services, how those energy services are met depends on the mix of fuels being produced (e.g., emitting vs. non-emitting) and the end-use technologies being used (e.g., EVs, heat pumps, etc.) – which are impacted by market conditions and policy
- The use of fossil fuels across the economy results in GHG emissions across the entire energy system.
- We also account for GHG emissions that are driven by economic activities rather than energy use – for example, industrial processes, waste, agriculture and land use.
- In the NZ scenarios we also account for technologies that act as emissions sinks or that offset any GHG emissions remaining across the economy – including nature-based climate solutions, the use of biomass combined with CCS, CCS across industrial subsectors, and direct air capture (DAC).
Background – Canada’s Energy Future 2023: Energy Supply and Demand Projections to 2050
On Tuesday, June 20, 2023, the CER launched the Energy Information Program’s flagship publication.
Canada’s Energy Future 2023 report (EF2023) explores how possible energy futures might unfold for Canadians over the long term in three scenarios to 2050: Global Net-Zero (GNZ), Canada Net-Zero (CNZ), and Current Measures (CM). For the first time, EF2023 fully models net-zero GHG emissions by 2050 and what a net-zero world could look like. Our scenarios cover all energy commodities and all Canadian provinces and territories. We use economic and energy models to do this analysis.
Key points
- Canada’s energy system is complex and diverse, and how we produce and use energy in a netzero world will be dramatically different than it is today.
- The shift towards a net-zero future in Canada will considerably alter its energy landscape, impacting how Canadians produce and consume energy.
- Electricity would become the most important energy source for Canadians, while the use of fossil fuels falls significantly in both net-zero scenarios.
- As Canadians transition away from using fossil fuels, we will see current technologies replaced with electricity-powered alternatives, such as electric vehicles and heat pumps.
- Fossil fuels still play an important part in Canada’s energy system in both net-zero scenarios; however, oil and gas production falls in both net-zero scenarios, falling substantially when global climate action is strongest and when commodity prices are the lowest.
- Canadians will use more electricity from increasingly low-carbon sources, such as wind, solar, and nuclear, to power Canada’s electricity system.
- Net-negative emissions from other sectors, including the electricity sector, will offset positive emissions from other sectors helping Canada to achieve net-zero by 2050.
- Canadian power systems will continue to be distinct across the country, even in a net-zero future.
- Reaching net-zero in our scenarios is driven by increasingly strong climate policies in Canada and abroad.
- The results in EF2023 are not predictions about the future, nor are they policy recommendations. Rather, they are the product of scenarios based on a specific premise and set of assumptions.
- Policy, global energy markets, the pace of climate action in Canada and around the world, technology, consumer behaviour and preferences will all influence Canadian energy and emission trends.
Electricity
- Electricity will play a key role in offsetting the decline in fossil fuel use and will be an important contributor on our path to net-zero.
- The types of energy Canadians use changes dramatically, including using a lot more electricity in our net-zero scenarios.
- Electricity demand grows from 2021 to 2050, much of it from new areas such as electric vehicles, heat pumps and hydrogen production, while total energy use declines.
- In both net-zero scenarios, electricity use more than doubles from 2021 to 2050, becoming the dominant energy source in the energy system.
- Greater reliance on electricity improves energy efficiency across the country, leading to a decrease in energy usage of up to 22% by 2050.
- Wind and solar generation provide much of the additional electricity needed to reach net-zero by 2050, given their low cost.
- With rising wind and solar capacity levels, power systems require flexible generation sources to balance supply and demand. Natural gas generation fills that demand and is increasingly equipped with carbon capture and storage.
- Among all technologies, wind is expected to contribute the greatest amount of new electricity generation by 2050, increasing over ninefold from current levels in both net-zero scenarios.
- Canada’s electricity system is regionally diverse, with the generation mix primarily determined by the resources available in each province or territory.
- Traditional coal-fired generation will be phased out of electricity generation by 2030.
Emissions
- The electricity system, which reaches net-zero by 2035 and achieves net-negative emissions thereafter, is the backbone of our net-zero scenarios.
- Global and Canadian efforts to reduce greenhouse gas (GHG) emissions will be a critical factor in how energy systems evolve.
- Low and non-emitting energy sources – including renewables, nuclear, and fossil fuels with carbon-capture storage (CCS) – increase to make up the majority of energy use.
- Fossil fuel use, where emissions are not captured and stored, is projected to fall by 65% by 2050 in the Global Net-zero Scenario and by 56% in the Canada Net-zero Scenario.
- Each region capitalizes on their own resources and technological expertise to drive the electricity sector towards net-zero.
- Electricity transmission between provinces is a key factor that enables the electricity system to reach net-zero.
- In both net-zero scenarios, GHG emissions from producing and processing oil and natural gas will fall about 90% lower by 2050 than in 2021.
- Despite all sectors significantly reducing emissions, several sectors, like buildings, heavy industry and oil and gas, will have positive GHG emissions by 2050 in both net-zero scenarios. However, the net-negative emissions from other sectors, including the electricity sector, will offset these positive emissions.
Emerging technologies
- Several emerging technologies and fuels play a key role in achieving net-zero, especially in decreasing more difficult-to-reduce emissions in the electricity, heavy industry, and oil and gas sectors.
- Switching to electricity for some energy uses is not possible or less effective than other low- or non-emitting options.
- CCUS, hydrogen, negative emission technologies, and nature-based solutions become essential tools to reduce emissions in our net-zero scenarios.
- Technologies like bioenergy with carbon capture and storage (BECCS) and direct air capture will result in negative emissions by 2050 in both net-zero scenarios, allowing emissions to balance to zero.
- A robust hydrogen economy develops in both net-zero scenarios, with most hydrogen used in heavy freight vehicles and industries like chemicals, iron and steel, and petroleum refining.
- Biomass-based hydrogen production, when coupled with CCUS, results in net-negative GHG emissions, much like BECCS electricity generation.
Oil & natural gas production
- Canada’s oil and natural gas industry significantly reduces its emissions in our net-zero scenarios, but while production declines, the pace of global climate action determines by how much.
- Global crude oil and natural gas prices are a key driver of the Canadian energy system and are determined by supply and demand factors beyond Canada’s borders.
- Canadian oil and gas production is primarily influenced by oil and gas prices in our net-zero scenarios, with carbon policy also playing a substantial role.
- Canadian crude oil production peaks in 2026 in our GNZ Scenario and 2029 in our CNZ Scenario but declines toward 2050 in both net-zero scenarios. Even with low prices and increasingly ambitious climate policies, oil production is expected to continue in 2050.
- Global oil and natural gas prices fall steeply In the GNZ Scenario in response to falling global demand for fossil fuels over the coming decades.
- Canadian Crude oil production falls to 1.3 million barrels per day (MMb/d) by 2050, 75% lower than in 2022.
- Canadian Natural gas production falls by 68%, reaching 5.5 billion cubic feet per day (Bcf/d) by 2050.
- Prices fall less than in the CNZ Scenario than the Global Net-Zero Scenario due to less ambitious global climate action and higher global demand for fossil fuels.
- Oil production will fall to 4.1 MMb/d by 2050, 20% lower than in 2022
- Natural gas production is 36% lower than in 2022, falling to 11 Bcf/d.
- Oil and natural gas production is the highest, as are emissions from the sector, in the CM Scenario, as prices are higher and future climate action is the least ambitious.
- Crude oil production will reach 6.1 MMb/d by 2050, 22% higher than in 2022.
- Natural gas production grows to 21.5 Bcf/d, a 24% increase over the projection period.
- The vast majority of oil sands production in 2050 is from oil sands facilities that are already producing.
- Future global climate policy and its effect on global crude oil demand and prices will have direct impacts on Canadian oil and gas production.
Oil and gas exports
- A key issue for Canada’s energy system over the last ten years has been export capacity of western Canadian oil export pipelines and crude-by-rail.
- In the GNZ Scenario, western Canadian crude oil available for export rises in the near term before falling after 2030, staying below the total hypothetical export capacity throughout the projection period.
- In the CNZ Scenario, western Canadian crude oil available for export rises more in the near term. It remains higher than in the GNZ Scenario after 2030, though it remains below estimated export capacity.
- Declining demand for RPPs in western Canada reduces demand for oil at local refineries, which leaves more production available for export.
- Canadian oil supply comes close to but does not exceed nominal export capacity for much of the projection period in the CM Scenario, peaking in 2035 and declining gradually thereafter.
- Investment in natural gas production is spurred by assumed liquefied natural gas (LNG) exports in all three scenarios, boosting production from what it would be without LNG exports.
- While the economics of Canadian LNG were examined, these are assumptions, not results from the modelling:
- In the GNZ Scenario, we assume LNG exports begin in 2025, reaching 2.0 Bcf/d by 2029 and then dropping to 0.3 Bcf/d by 2046 in response to falling LNG demand globally.
- In the CNZ Scenario, LNG exports reach 3.8 Bcf/d by 2030 and remain at that volume by 2050. In the CM Scenario, LNG exports are the highest, reaching 4.6 Bcf/d by 2034 and remain at that volume by 2050.
- EF2023 does not explore the complex interactions between pipelines, energy supply and demand.
- Estimates of total available pipeline capacity and the level of structural rail are uncertain and the result of many key assumptions.
- Available capacity on existing pipeline systems could be higher or lower than reflected because pipeline systems evolve over time. The level of structural crude-by-rail could also be higher or lower than reflected in the report.
- Having spare capacity in pipeline systems provides flexibility during maintenance and outages, which is useful for exporters who continue to need to ship oil out of Western Canada. It also benefits other operational needs.
Oil and gas demand
- Although natural gas will remain an important part of Canada’s energy mix, total demand will decline 35% by 2050 from current levels.
- Use of refined petroleum products and natural gas liquids gradually falls throughout most of the projection period, driven by declines in gasoline and diesel fuel demand.
- Demand for refined petroleum products used for things like petrochemical feedstocks, asphalt, lubricants, and aviation fuel is relatively steady throughout the projection.
- Canada exports most of its oil production, with producers depending on markets outside Canada to buy most of our oil supply. Demand for Canadian oil depends strongly on how aggressively the world pursues global 1.5 °C targets.
Energy Demand
- In all three scenarios, energy use increases in the near term. In the long term, energy use falls in both net-zero scenarios, while energy use is relatively stable in the CM Scenario.
- While we project continuing economic and population growth, end-use demand declines by 22% from 2021 to 2050 in the GNZ Scenario and 12% in the CNZ Scenario.
- This decline is mainly due to switching to different technologies and fuels, more efficient use of energy, and lower activity levels in some sectors.
- In the CM Scenario, energy use is stable until 2040. It slowly begins increasing again as climate policies do not strengthen beyond 2030, and the economy and population continue to grow, increasing energy use.
Report
- Canada’s Energy Future series provides neutral and fact-based energy analysis to inform Canadians how our country’s energy future might unfold over the long term.
- EF2023 presents three scenarios and two explore pathways to net-zero emissions by 2050. The pace of climate action in Canada and globally to reduce GHG emissions is the main difference between the two net-zero scenarios.
- Our scenarios provide insight into what the energy system might look like if Canada reaches its net-zero goals based on the pace of climate action domestically and globally.
- What happens globally affects Canada’s economy and energy system. EF2023 focuses on Canada, and we do not model global energy markets for the scenarios.
- The analysis in this report is not a prediction of future outcomes but a projection of what might occur using economic and energy models based on assumptions from past and current trends.
- Future development of policies and technologies could lead to different outcomes than those presented in this analysis.
Background - Route deviation in the Pípsell (Jacko Lake) area
Chronology – Process
- 12 July 2023 – Stk’emlúpsemc te Secwépemc Nation (SSN) filed a letter indicating that they were aware of Trans Mountain’s plans to file a deviation application in the Pipsell area of BC.
- The Pipsell area includes Jacko lake and surrounding areas. It holds profound spiritual and cultural significance to SSN.
- 10 August 2023 – Trans Mountain filed its deviation application. It requested an expedited decision (no later than 21 August 2023) in order to maintain its anticipated construction schedule for the area.
- Trans Mountain said the deviation was required to accommodate a change in construction methodology – from micro-tunnelling to a combination of horizontal directional drilling (HDD) and conventional open trench – due to significant technical challenges encountered along a portion of a revised route previously approved in 2022.
- 16 August 2023 – Commission established a hearing process including steps for the Commission to ask written information requests (IRs) of Trans Mountain, for SSN to file written submissions, and for Trans Mountain to file reply submissions. The Commission noted that it might hold a possible oral hearing day on 6 September 2023.
- 30 August 202 – Commission issued a letter delaying (and expanding) the oral hearing dates to 14-15 September 2023 (reserving 18 September 2023 as a possible third day).
- 11 September 2023 – Commission granted a request from SSN to move the oral hearing to 18-19 September 2023 to accommodate the availability of SSN’s cultural heritage expert and Knowledge Keeper.
- The oral hearing was held from 18-20 September 2023 in Calgary, Alberta and included oral Indigenous knowledge from Jeanette Jules, SSN’s Knowledge Keeper, as well as crossexamination and argument.
- 25 September 2023 – Decision and order issued.
- 20 October 2023 – Reasons for decision issued.
Reasons for Decision
- The Commission’s analysis and findings summarizes the views of parties on substantive issues with respect to the application – related to engineering, economics, environmental and socioeconomic effects, and the rights and interests of Indigenous Peoples.
- The Commission was of the view that it designed its process in a procedurally fair manner and with a view to being transparent, accessible, flexible, and responsive to the needs of the parties, including SSN as a rights-bearing Nation.
- As an expert regulatory tribunal, the Commission found that the deviation is required based on the available technical and economic evidence.
- The Commission found that continued micro-tunnelling is most likely to fail, whereas the proposed 455-m-long HDD is likely to be successfully completed.
- The Commission stated that requiring Trans Mountain to continue with micro-tunnelling in the face of substantial technical challenges and other impediments risks causing additional and avoidable surface disturbance, would likely delay the TMEP’s completion by at least 10 months, and could lead to a loss of at least $2 billion in revenues by Trans Mountain with additional adverse impacts on shippers and other parties.
- The Commission indicated that the deviation is within the approved pipeline corridor and follows the same alignment as the original route approved by the Commission in April 2020.
- The Commission assessed the effects of the application on the rights of Indigenous Peoples and found that they can be meaningfully addressed, based on the mitigation measures identified in the application and through conditions imposed by the TMEP.
- The Commission expects Trans Mountain to uphold its commitments in respect of the application and construction in the Pípsell Area in relation to the broader TMEP, which includes commitments related to enhanced reclamation standards, taking measures to reduce overall disturbance (including by reducing grading and the size of the footprint for open trench construction, where possible) and continuing to dedicate the time necessary to meaningfully engage and involve SSN in the construction of the deviation.
- Date modified: