ARCHIVED - Canada’s Energy Futures 2020 Supplement: Energy Demand
This page has been archived on the Web
Information identified as archived is provided for reference, research or recordkeeping purposes. It is not subject to the Government of Canada Web Standards and has not been altered or updated since it was archived. Please contact us to request a format other than those available.
Canada’s Energy Futures 2020 Supplement: Energy Demand [PDF 310 KB]
Data and Figures [EXCEL 619 KB]
Primary Energy Demand: Short Term and Long Term Changes
Evolving Scenario
Short Term Changes: 2020 and 2021 COVID-19 pandemic and recovery |
Long Term Changes: 2022 - 2050 Lower demand, more renewables |
Primary demand is the total energy used in Canada, including energy to generate electricity.
19%Demand decline from 2019 to 2050 |
Description:
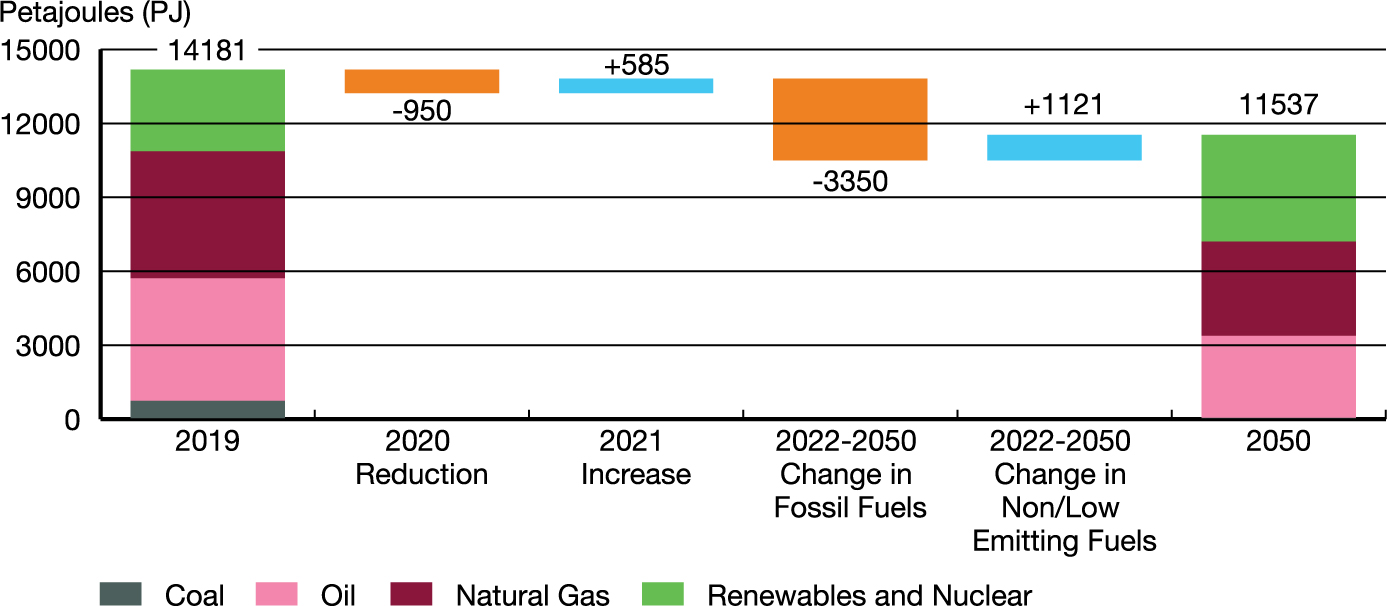
This chart shows changes in primary energy demand in Canada from 2020 to 2021 and then from 2022 to 2050 in the Evolving Scenario. In 2020 primary demand is estimated to drop by 950 PJ, and in 2021 to increase by 585 PJ. Over the 2022 to 2050 period, primary demand of fossil fuels is expected to decline by 3350 PJ and demand for non or low emitting fuels is expected to increase by 1121 PJ. Overall, primary demand goes from 14181 PJ in 2019 to 11537 PJ in 2050.
Primary Energy Demand by Fuel and Share of Total Demand —
Evolving Scenario
Canada’s domestic fossil fuel consumption peaked in 2019 in the Evolving Scenario. By 2030, it is 12% lower, and 35% lower by 2050.
Renewables and nuclear grow by 31% by 2050 and become a larger share of the energy mix.
Description:
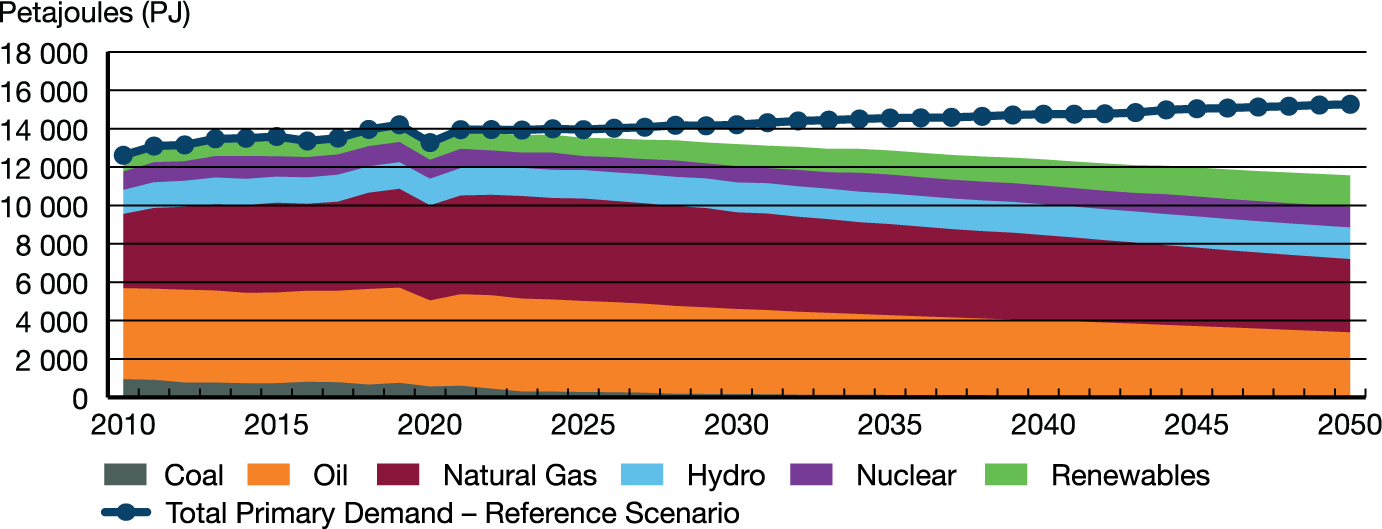
This chart breaks down primary energy demands in the Evolving Scenario, by fuel, throughout the projection period. Coal demand decreases from 660 PJ in 2018 to 60 in 2050. RPP and NGL demand decreases from 4,983 PJ in 2018 to 3310 PJ in 2050. Natural gas demand decreases from 5,016 PJ in 2018 to 3,732 PJ in 2050. Hydro demands increase from 1,375 PJ in 2018 to 1,647 in 2050. Nuclear demands increase from 1,052 PJ in 2018, to 1,073 in 2050. Renewable demands increase from 878 PJ in 2018, to 1,643 in 2050. Total primary demand in the Evolving Scenario decreases from 13,964 PJ in 2018, to 11,467 in 2050, compared to an increase to 15,273 PJ in the Reference Scenario.
Refined petroleum product (RPP) use gradually declines due to energy efficiency improvements and increasing use of renewable fuels and electricity. Natural gas use falls in the latter parts of the projection, as renewables play a bigger role in electricity generation, and energy needs to produce fossil fuels decrease.
Description:
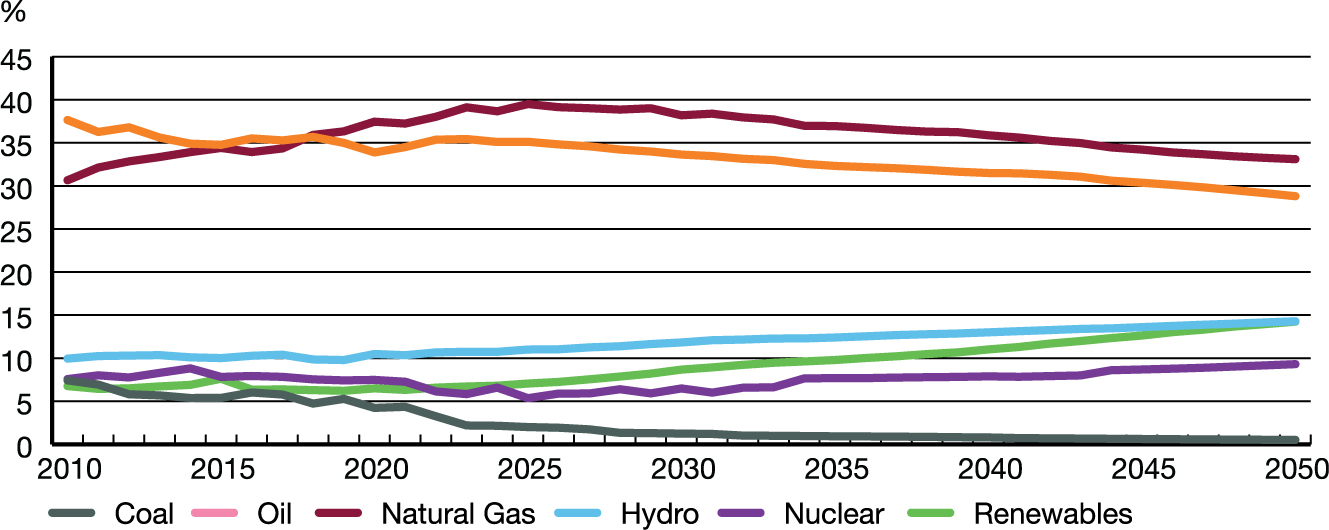
This chart compares primary energy use from 2005 to 2050, by fuel. Renewables’ and nuclear’s share of total energy use increases from 24% in 2018, to 38% in 2050, or an increase from 3,305 PJ in 2018 to 4346 by 2050, in the Evolving Scenario. RPP’s and natural gas liquids share of total energy use decreases from 36% in 2018, to 29% in 2050, or a decrease from 4,983 PJ in 2018 to 3310 by 2050, in the Evolving Scenario. Coal’s share of total energy use decreases from 5% in 2018, to 0.5% in 2050, or a decrease from 660 PJ in 2018 to 60 by 2050, in the Evolving Scenario. Lastly, natural gas’s share of total energy use decreases from 36% in 2018, to 33% in 2050, or a decrease from 5,016 PJ in 2018 to 3,732 by 2050, in the Evolving Scenario.
Sectoral End-Use Demand Changes — Evolving Scenario
Description:
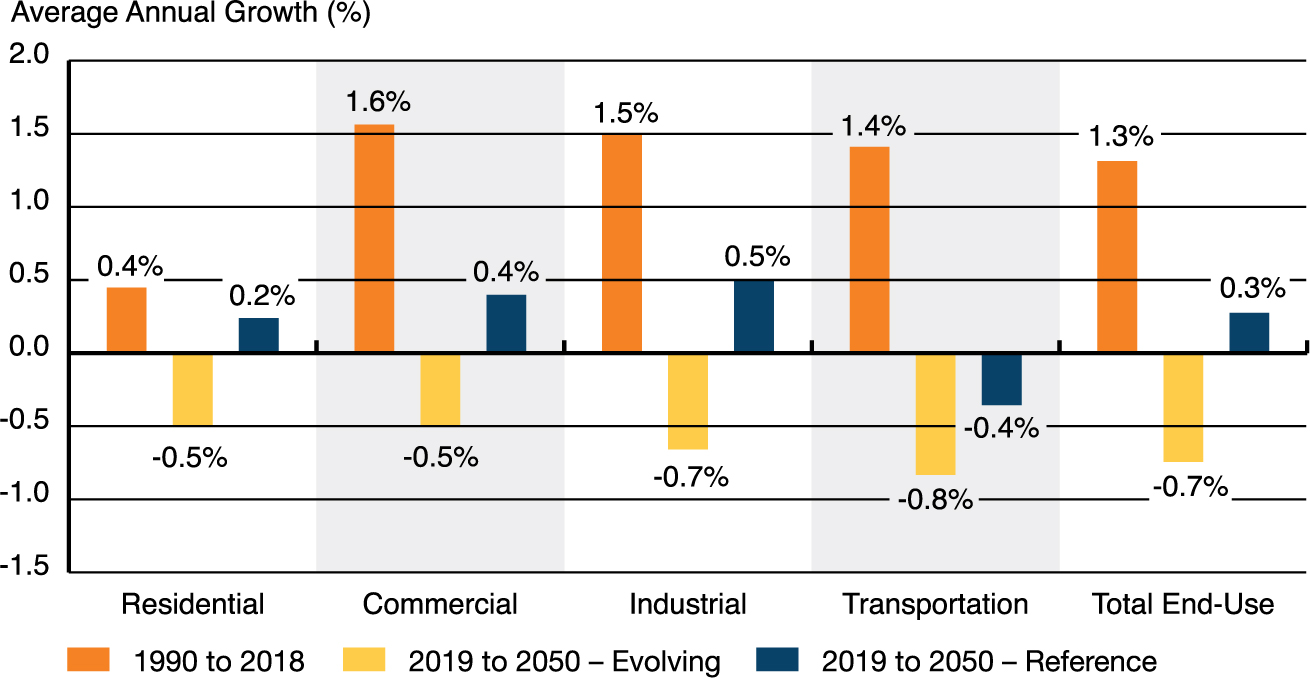
This chart compares total end-use demand annual average growth rates by sector. From 1990 to 2018, residential end-use demand increased by 0.4% per year. In the Evolving and Reference scenarios, end-use growth averages -0.5% and 0.2% respectively. From 1990 to 2018, commercial end-use demand increased by 1.6% per year. In the Evolving and Reference scenarios, end-use growth averages -0.5% and 0.4% respectively. From 1990 to 2018, industrial end-use demand increased by 1.5% per year. In the Evolving and Reference scenarios, end-use growth averages -0.7% and 0.5% respectively. From 1990 to 2018, transportation end-use demand increased by 1.3% per year. In the Evolving and Reference scenarios, end-use growth averages -0.7% and 0.3% respectively. Total end-use demand from 1990 to 2018 increases by 1.3% on average. In the Evolving and Reference scenarios, total end-use demand growth averages -0.7% and 0.3%, respectively.
Canadian energy use demand is projected to decline to 2050. These declines result from several drivers, including macroeconomics, energy production trends, energy efficiency improvements, policies, technology advancements, and market developments.
End-use demand is energy used by final consumers. It includes electricity, and excludes the energy used to generate electricity.
Sectoral End-Use Demand Changes — Evolving Scenario
Description:
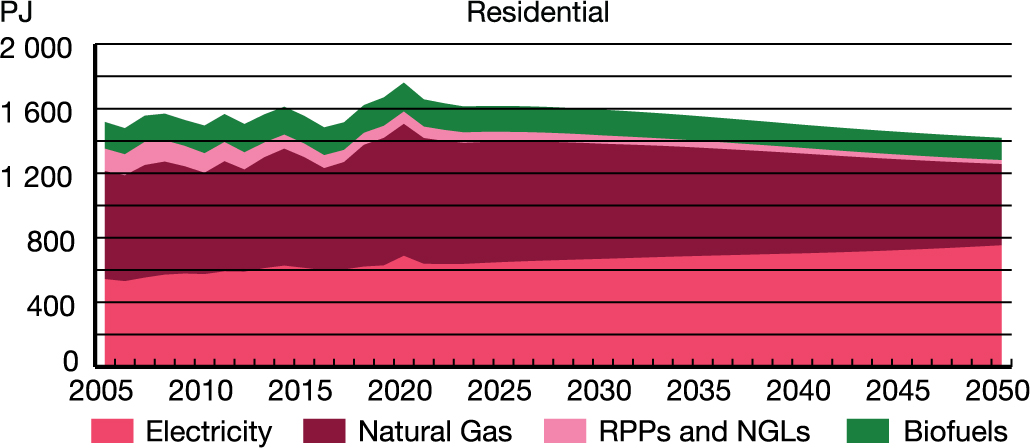
This chart breaks down fuel demand for the residential sector in the Evolving Scenario. Electricity demand increases from 621 PJ in 2018 to 753 PJ in 2050. Natural gas demand decreases from 755 PJ in 2018 to 504 PJ in 2050. RPPs and NGL demands decrease from 74 PJ in 2018 to 24 PJ in 2050. Biofuel demands decrease from 172 PJ in 2018 to 138 in 2050. Lastly, other fuel demands stay at 0 PJ throughout the projection period, from 2018 to 2050.
Description:
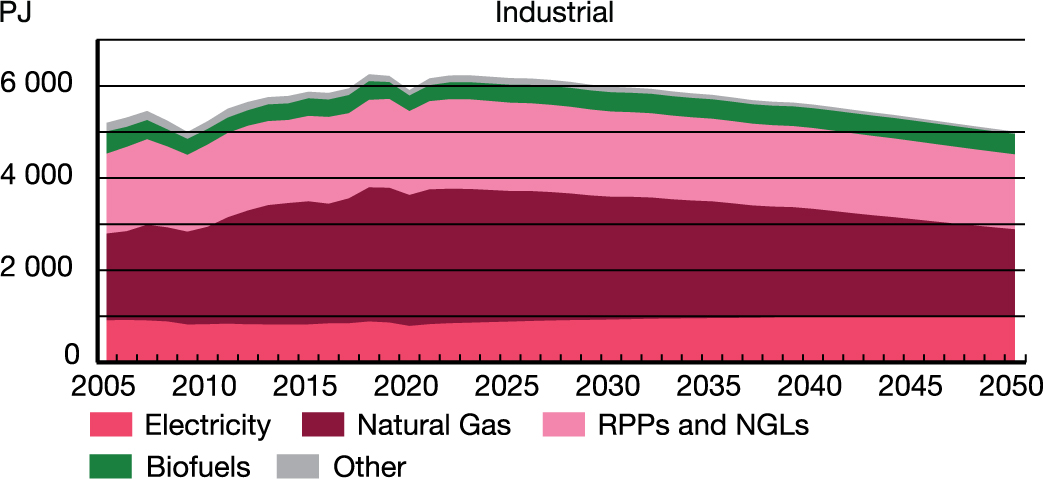
This chart breaks down fuel demand for the industrial sector in the Evolving Scenario. Electricity demand increases from 887 PJ in 2018 to 1006 in 2050. Natural gas demand decreases from 2911 PJ in 2018 to 1,882 PJ in 2050. RPP and NGL demands decrease from 1,898 PJ in 2018 to 1,625 PJ in 2050. Biofuel demands increase from 405 PJ in 2018 to 444 in 2050. Lastly, other fuel demands declines from 152 PJ in 2018, to 50 in 2050.
Description:
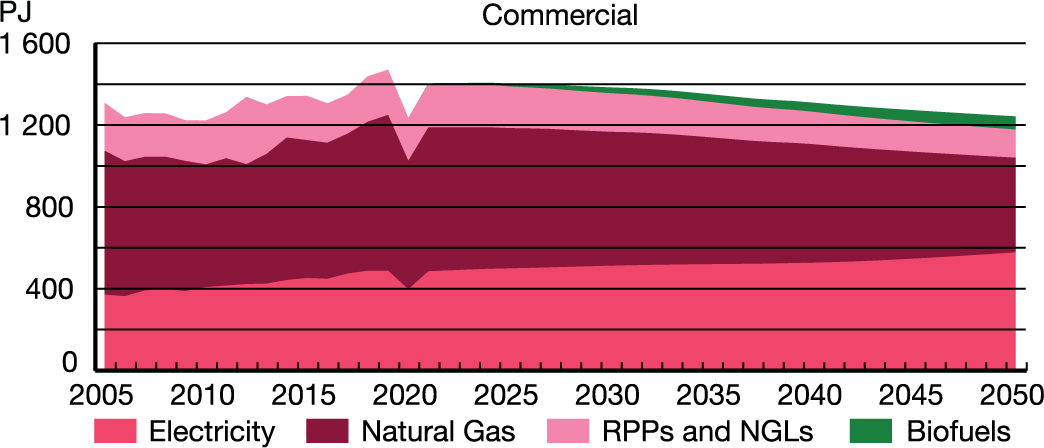
This chart breaks down fuel demand for the commercial sector in the Evolving Scenario. Electricity demand increases from 488 PJ in 2018 to 577 in 2050. Natural gas demand decreases from 728 PJ in 2018 to 463 PJ in 2050. RPP and NGL demands decrease from 223 PJ in 2018 to 138 PJ in 2050. Biofuel demands increase from 0.01 PJ in 2018 to 65 in 2050. Lastly, other fuel demands declines from 0.002 PJ in 2018, to 0 in 2050.
Description:
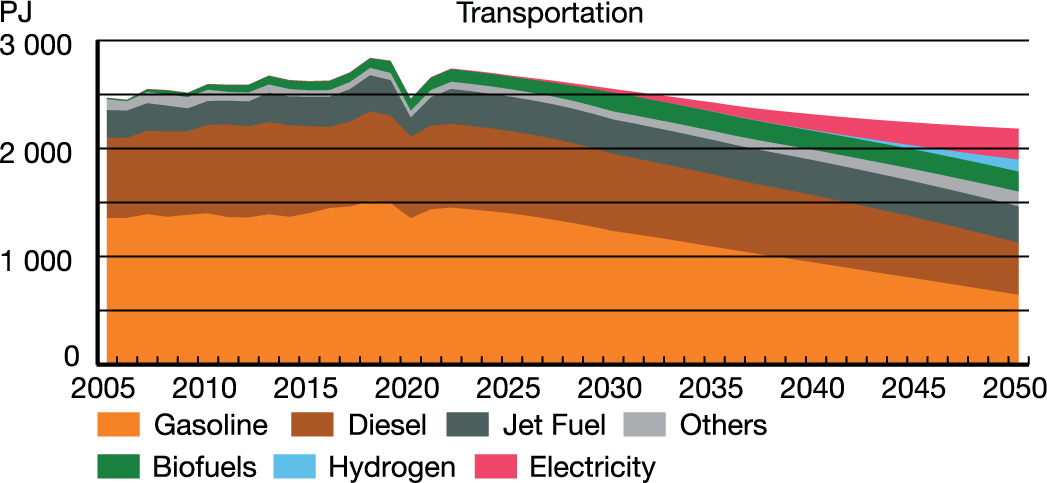
This chart breaks down fuel demand for the transportation sector in the Evolving Scenario. Gasoline demand decreases from 1,512 PJ in 2018 to 645 PJ in 2050. Diesel demand decreases from 830 PJ in 2018 to 480 PJ in 2050. Jet fuel demands increase from 335 PJ in 2018 to 337 PJ in 2050. Biofuel demands increase from 90 PJ in 2018 to 185 in 2050. Other fuel demands increase from 67 PJ in 2018, to 137 in 2050. Hydrogen demand increases from 0 PJ in 2018, to 112 in 2050. Lastly, electricity demand increases from 4 PJ in 2018 to 287 in 2050.
Macroeconomic Assumptions and Energy Intensity
Average Annual Growth Rates 2019 - 2050
| Real GDP | Population | Energy Use Per Person | Energy Use Per $ Real GDP | Fossil Fuel Use Per $ GDP | |
|---|---|---|---|---|---|
| Evolving Scenario | 1.4% | 0.8% | -1.4% | -2.0% | -2.7% |
| Reference Scenario | 1.6% | 0.8% | -0.6% | -1.3% | -1.4% |
| Gross Domestic Product (GDP) | |||||
Find the Report Appendix data at
https://apps.cer-rec.gc.ca/ftrppndc/dflt.aspx?GoCTemplateCulture=en-CA
- Date modified: