
Energy Demand and Emissions model
Model description
The EF2023 energy demand projections are created using the ENERGY 2020 model. ENERGY 2020 is a hybrid energy-economy model that simulates how capital stocks of energy supply and demand technologies change over time in response to many factors, including economic activity, energy prices, household and business decision making, and climate policy. It incorporates many types of historical data such as energy supply and demand, technology and market characteristics, energy prices, and consumer preferences, then creates projections for how the energy system may evolve under different scenarios.
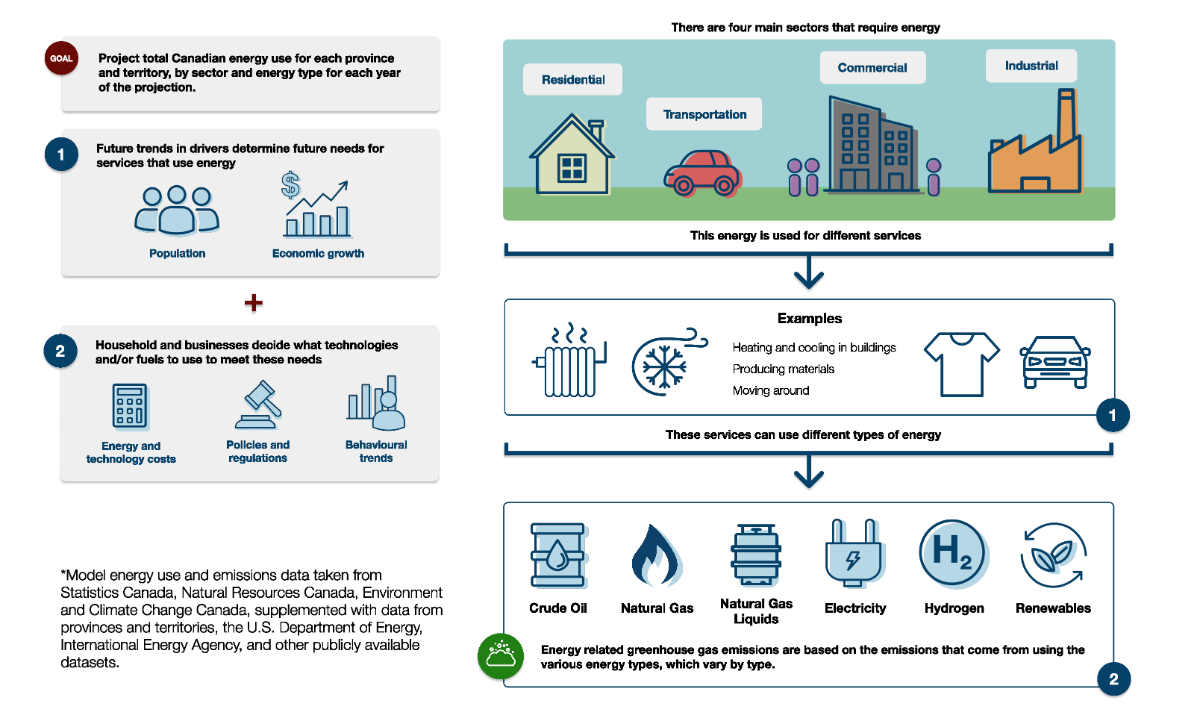
Figure ED.1: Energy demand and emissions model overview
Source and Description
Source: CER
Description: This infographic displays the steps and components in the Energy Demand Model. The goal of the model is to project total Canadian energy use for each province and territory, by sector and energy type for each year of the projection. The model analyses future trends, which determines future needs for services that use energy, such as population and economic growth. It also analyses household and business trends, then decides what technologies or fuels to use to meet future needs, including energy and technology costs, policies and regulations, and human behaviour trends.
Although ENERGY 2020 is comprised of both energy supply and demand models, EF2023 only uses a selection of ENERGY 2020’s supply models such as hydrogen. Supply projections of other fuels come from other supply models (e.g., crude oil, natural gas, electricity). This section focuses on the methodology behind ENERGY 2020’s demand model. Extensive documentation on ENERGY 2020, including model equations, can be found on the ENERGY 2020 website.
The key inputs and outputs of ENERGY 2020’s demand model are summarized in Table ED.1. Inputs include historical data, assumptions, and inputs from other models in the Energy Futures Modelling System. Outputs are related to energy demand, technological change, and emissions.
Macroeconomic inputs, such as projections for economic activity, exchange rates, and inflation, are developed by an external macroeconomic consultant. This is described at the end of this section in Macroeconomic inputs.
Table ED.1: Key inputs and outputs of ENERGY 2020’s demand module
| Key inputs | Key outputs |
|---|---|
|
|
Historical energy data is sourced from multiple datasets including Statistics Canada’s supply and demand dataset, the Natural Resources Canada’s Comprehensive End-Use Database, supplemented with additional details from Environment and Climate Change Canada (ECCC), Natural Resources Canada, and various provincial data sources.
Demand model method and structure
ENERGY 2020 produces annual projections of energy demand for each of Canada’s 10 provinces and 3 territories. It includes approximately 50 sub-sectors of the economy that are aggregated into four sectoral groupings: residential, commercial, industry, and transportation. ENERGY 2020 uses the same modeling approach and methodology across each of the sectors, building up energy demand from the energy requirements within the system.
In the model, energy demand is a consequence of households and businesses using energy consuming technologies to satisfy their needs. In each sector of the economy energy demand is tied to an economic “driver” that represents a sector’s activity, such as floor space for residential and commercial buildings, industrial products in the industrial sector (e.g., tonnes of steel for the steelmaking sector) and kilometers travelled in the transportation sector. As economic drivers change over time, so do the energy requirements of the system. Subsectors and economic drivers are outlined in Table ED.4.
In each economic sub-sector energy demand projections are based on energy end-uses, such as building heating and cooling, industrial production processes, or freight transport. These energy end-uses can be met using different technologies and fuels. For instance, the residential sector has heating as an energy end-use, which can be met by various technologies like natural gas furnaces, electric heat pumps, or electric baseboard heaters. Table ED.2 shows the various energy end-uses and fuels available in the model.
Table ED.2: Sectoral end-uses and fuels
| Sector | End-uses | Fuels available |
|---|---|---|
| Residential |
|
|
| Commercial |
|
|
| Industrial |
|
|
| Transport |
|
|
The calculation of energy demand in each sector is done by representing two types of energy: “process energy” and “device energy.” Process energy refers to the amount and type of energy services that a sector requires to function, such as the energy required to heat or cool a building. Device energy refers to the technologies required to meet the demand for process energy, such as furnaces or air conditioners.
Figure ED.2 illustrates how energy demand is calculated. Economic drivers are translated into “production capacity” as a representation of each sector’s economic activity. In each year, new production capacity is added, and old production capacity is retired and replaced. Changes in production capacity drive changes in the need for process energy, which in turn drives changes in the need for device energy. For example, the economic driver for Canada’s residential energy demand is floorspace. In ENERGY 2020, floorspace is translated into a production capacity variable. If there is growth in the residential sector, then the construction of new homes will show up in the model as new floorspace. This increase in floorspace leads to an increase in process energy requirements, such as heating and cooling, which in turn increases the sector’s device energy requirements. To meet this new demand, technologies, such as furnaces and air conditioners, are purchased by households.
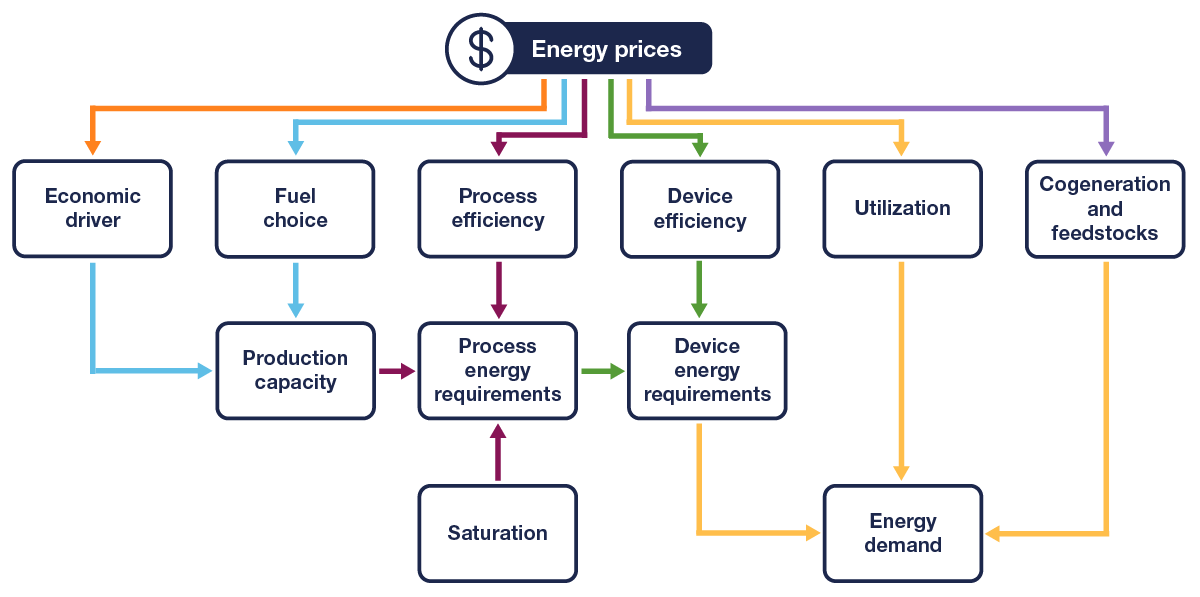
Figure ED.2: How ENERGY 2020 derives energy demand
Source and Description
Source: Systematic Solutions Inc:
Description: This flow diagram illustrates the sequence of operations in the ENERGY 2020 model. It shows economic drivers influencing production capacity, which in turn influence process energy requirements, along with device saturation (i.e., the share of homes that have a device, such as air conditioning). Process energy requirements influence device energy requirements, which in turn influence energy demand. Energy prices influence all these steps, through fuel choice (via production capacity), process efficiency (via process energy requirements), device energy requirements (via device efficiency), and energy demand (via utilization). Cogeneration and feedstock demand also influence total energy demand and are influenced by prices.
The energy system and how it changes over time depends on more than just changes in production capacity; it also depends on how households and businesses make decisions regarding technology purchases. One of the key drivers of decision-making related to technology purchase, is the price of energy, which partially dictates the technology and efficiency level chosen. For instance, a household may decide to purchase a high efficiency electric heat pump over a low efficiency natural gas furnace to heat their home.
Ultimately, energy demand is a function of device energy demand combined with utilization factors (including weather) along with cogeneration and feedstock energy demands. Cogeneration demands refer to industrial energy demand to produce electricity and heat in tandem. Feedstock demands refer to industrial energy demand for the purpose of production and not related to the combustion of fuels for energy.
There are three key methods that contribute to ENERGY 2020’s calculation of energy demand:
- Tracking energy capital stocks.
- Technology market share.
- Energy efficiency/capital cost trade off curves.
Tracking energy capital stocks
ENERGY 2020 applies the principles of system dynamics to track energy technology retirements, replacements, and additions to energy capital stockDefinition*. Each year capital stock changes due to one or more of the following:
- Retirements of capital stock due to wear-out (at end of physical lifetime); replaced with new capital stock.
- Retirements of capital stock due to economic decline; not replaced.
- Retirements of capital stock due to retrofits (before end of physical lifetime); replaced with new capital stock.
- Additions of new capital stock due to economic growth.
New energy technologies gradually replace old technologies over time. The acquisition of new energy using technologies are driven by decisions made by businesses and consumers. These decisions are informed by consumer choice theory.
Technology market share
The first decision households and businesses face when acquiring new energy-using technologies is which technology to adopt. For instance, when replacing a natural gas furnace to heat a home, a consumer will have the choice to replace it with one of many heating technologies and fuel options, such as a new natural gas furnace, electric baseboards, or an electric heat pump.
A technology will capture or lose market share depending on how it compares to other technologies based on both price and non-price factors that impact household and business decision making. Price factors include capital cost, operating and maintenance costs, and fuel costs, whereas non-price factors include behavioural components such as a preference for a particular type of technology due to environmental benefits or a resistance to another technology due to perceived barriers.
Energy efficiency/capital cost tradeoff curves
Process energy and device energy both have associated efficiency levels. Process efficiency is measured as a unit of economic output per unit of energy input (e.g., an industrial sector’s gross output per gigajoule (GJ) of the sector’s energy use). Most device efficiencies are measured as a unit of energy service output per unit of fuel input (e.g., GJ/GJ). In the transportation sector, device efficiency is measured as distance traveled per unit of fuel input (e.g., km/GJ). Household and business choices about efficiency levels are based on trade-offs between technology capital costs and efficiency levels and are impacted by energy prices.
The energy efficiency/capital cost curve represents a tradeoff between high up-front costs and high future fuel costs. For instance, a high efficiency furnace will typically have higher up-front capital costs but lower fuel costs in the future. A low efficiency furnace will be the opposite. The efficiency of new technologies purchased will depend on the household and business’s perception of this tradeoff.
The energy efficiency/capital cost trade-off curves in ENERGY 2020 are based on historical relationships of capital cost and efficiency choices. Curves are developed for both process and device energy efficiency and the tradeoff can be adjusted to simulate technology change. Both process and device efficiencies have limits determined by either technological or physical constraints. This maximum efficiency can change over time as technological innovation and breakthroughs occur.
Emissions in ENERGY 2020
Emissions in the ENERGY 2020 demand model are tracked by the source of emissions and the type of pollutant. The source of emissions come from both energy-related (combustion and non-combustion) and non-energy related sources. Table ED.3 shows the greenhouse gas emissions included in ENERGY 2020.
There are four sources of emissions tracked in ENERGY 2020:
- Energy emissions, from the combustion of fuels.
- Process emissions, from economic activity.
- Feedstock emissions, from non-combusted fuels used as raw material input to processes.
- Fugitive emissions, from leaks of gases into the air (venting, flaring, and other fugitives).
Table ED.3: Greenhouse gases (GHG) and criteria air contaminants (CAC) in ENERGY 2020Footnote 1
| Greenhouse gases |
|---|
|
ENERGY 2020 uses emissions coefficientsDefinition*, which are the amount of a GHG or CAC emitted per unit of energy used, to calculate emissions for each type of pollutant. Coefficients vary by the source of emissions. For emissions caused by the combustion of fuels, the coefficients are defined as the unit of emissions produced per unit of energy combusted. For other sources of emissions, coefficients are defined as the unit of emissions produced per unit of economic activity (process emissions), per unit of raw fuel use (feedstock emissions), or per unit of gas leakage (fugitive emissions). Total emissions are calculated by multiplying the emissions coefficients by the amount of energy consumed for energy-related emissions, the amount of economic activity for process emissions, the amount of raw fuel used as a feedstock for feedstock emissions, and the amount of gas leaked for fugitive emissions.
Emissions coefficients for GHG emissions are known energy-related engineering calculations. Historical coefficients are directly input into ENERGY 2020.
ENERGY 2020 also has partial representation of non-energy emissions across Canada. Non energy emissions come from agriculture, forestry, waste, and land use sectors. These emissions, as they are not tied to energy, are calibrated to historical data, and only change over time due to improvements in practices or environmental efforts defined outside the model. For instance, an improvement in practice could be capturing methane from landfills, using cover cropsDefinition* in agriculture, or restoration of marginal landsDefinition*. These improvements would lead to a reduction in non-energy emissions.
Policy analysis
The ENERGY 2020 demand model is used to simulate the effect of energy and climate policies on energy demand and emissions. It can be used to analyze the impact of different types of policies, including but not limited to, emissions pricing policies like a price on carbon, regulations like energy efficiency and technology standards, and incentives like subsidies and grant programs.
Climate and energy policies influence how households and businesses make decisions. Since ENERGY 2020 simulates energy related decision-making processes, it can incorporate policies into the simulation. Policies can be targeted in the model to specific regions, sectors, industries, end-uses, technologies, fuels, and pollutants. This ensures ENERGY 2020 can examine the impacts of policies in detail.
Macroeconomic inputs
The ENERGY 2020 demand model is dependent on macroeconomic projections for key inputs that influence energy demand. These inputs drive activity levels, and shape end-use consumer technology and energy prices.
To develop macroeconomic projections that are internally consistent with each scenario, the team works with an external macroeconomic expert. Since 2016, this has been Stokes Economics and their PROVMODS economic model.
PROVMODS is a Canada-focused, bottom-up model, where regions, provinces and territories are represented and then summed up to Canadian totals. The supply-side of PROVMODS covers close to 50 industries including primary sectors, utilities, construction, manufacturing, and private and public service sectors. Each industry incorporates input/output information from Statistics Canada to model inter and intra-industry demand relationships, and final demand expenditures impacts. The demand side of PROVMODS incorporates the Canadian System of Macroeconomic Accounts (CSMA). PROVMODS includes a major projects inventory and an endogenousDefinition* population model.
PROVMODS exchanges a variety of information with the Energy Futures Modeling System. PROVMODS receives key energy-related parameters like crude oil and natural gas price assumptions, climate policy assumptions, major energy projects (including LNG exports, major electricity developments, hydrogen, carbon capture and storage, and more), oil and gas production projections, and carbon pricing revenues. PROVMODS supplies the Energy Futures Modeling System key inputs such as population, households, buildings floorspace, gross output by industry, gross domestic product by province and territory, inflation, and exchange rate.
Table ED.4: ENERGY 2020 demand model sectors, sub-sectors, and macroeconomic drivers
| Sector | Sub-sector | Sub-sector economic driver |
|---|---|---|
| Residential | Single family | Single family floorspace |
| Multi family | Multi family floorspace | |
| Other residential | Other residential floorspace | |
| Commercial | Wholesale trade | Total commercial floorspace |
| Retail trade | ||
| Warehousing and storage | ||
| Information and cultural industries | ||
| Offices | ||
| Educational services | ||
| Health care and social assistance | ||
| Arts, entertainment and recreation | ||
| Accommodation and food services | ||
| Other commercial | ||
| Natural gas distribution | Natural gas demand | |
| Oil pipelines | Canadian crude oil production | |
| Natural gas pipelines | Canadian natural gas production | |
| Street lighting | GDP | |
| Industrial | Paper | Gross output, sector specific |
| Chemicals and fertilizers | Gross output, sector specific | |
| Petroleum refining | Gross output, sector specific | |
| Cement | Gross output, sector specific | |
| Iron and steel | Gross output, sector specific | |
| Aluminum and non-ferrous | Gross output, sector specific | |
| Other manufacturing | Gross output, sector specific | |
| Metal mining | Gross output, sector specific | |
| Non-metal mining | Gross output, sector specific | |
| Light oil production | Production | |
| Heavy oil production | Production | |
| Oil sands in-situ | Production | |
| Oil sands mining | Production | |
| Oil sands upgraders | Production | |
| Gas production | Production | |
| LNG production | Production | |
| Coal mining | Gross output, sector specific | |
| Construction | Gross output, sector specific | |
| Forestry | Gross output, sector specific | |
| Agriculture | Gross output, sector specific | |
| Waste | Gross output, sector specific | |
| Direct air capture | Amount captured | |
| Transportation | Passenger | Population |
| Freight | GDP | |
| Air passenger | Population | |
| Air freight | GDP | |
| Foreign passenger | GDP | |
| Foreign freight | GDP | |
| Off-road | GDP |
- Date modified: