Natural Gas Liquids (NGL) Supply and Disposition Model
Model Description
In the Energy Futures Modeling System natural gas production is a key driver of natural gas liquids (NGL) production, and future natural gas and NGL prices are key drivers of future natural gas and NGL production. Natural gas prices could be higher or lower depending on demand, technology, geopolitical events, and the pace at which nations enact policies to reduce GHG emissions, based on the scenario modelled. NGL demand and prices are also a key driver in production, exports, and imports of NGLs.
Figure NGL.1: Natural gas liquids model overview

Source and Description
Source: CER
Description: The infographic provides a visual overview of the natural gas liquids (NGL) supply and disposition model. The model is used to determine projected Canadian production and demand by type of NGL in a given year.
NGLs are predominantly produced by processing natural gas from the Western Canada Sedimentary Basin (WCSB)Definition*, but some are also produced as a by-product of oil refining or bitumen upgrading. Raw natural gas at a wellhead is comprised primarily of methane, but often contains other hydrocarbons and some contaminants. These other hydrocarbons may include ethane, propane, butane, pentanes, and heavier hydrocarbons, some of which are produced as condensate. NGL production projections are heavily dependent on the assumed natural gas production projections and assumed NGL content of that natural gas. Projected imports are also discussed.
NGL disposition includes demand and exports out of Canada. Demand is based on expected petrochemical feedstock demand, as well as other Canadian demand modelled in the Energy Demand Model. Exports generally equate to what is left of the supply after domestic needs are calculated.
Domestic NGL production
NGL production from western Canadian natural gas production
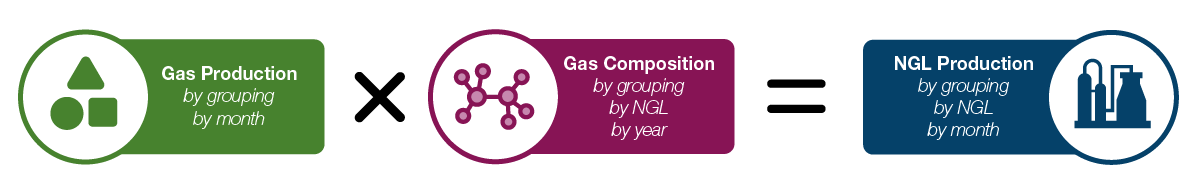
Figure NGL.2 summarizes the main method for estimating NGL production from gas processing in western Canada (British Columbia (B.C.), Alberta, and Saskatchewan). Historical and projected gas production comes from the EF2023 gas production analysis. Gas compositions are the amounts of hydrocarbons and contaminants in natural gas at a wellhead. Compositions vary depending on where, and what type, of natural gas resource is produced. Multiplying the amount of natural gas with its composition equals the volume of each NGL component in the gas.
Figure NGL.2: Overall NGL production from natural gas processing method
Source and Description
Source: CER
Description: This flowchart illustrates the overall NGL production from natural gas processing method. In this method, gas production (by grouping and by month) are multiplied by gas composition (by grouping, by NGL, by year), to get NGL production (by grouping, by NGL, and by month).
Groupings
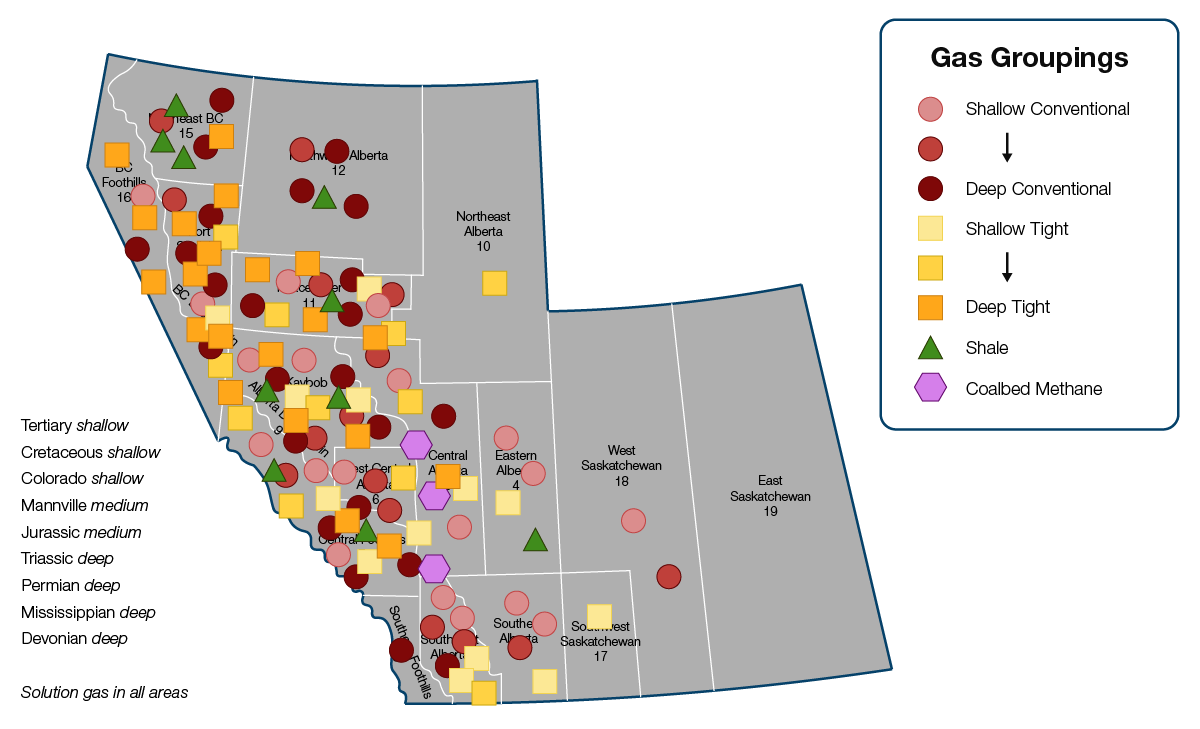
Conventional, tight, shale, coalbed methane (CBM), and solution gas resources are grouped geographically based on areasFootnote 1 in Alberta, B.C., and Saskatchewan, and by geological zone, as shown in Figure NGL.3. In this analysis, gas production from the Montney Formation is separate from the other tight gas sources and is shown in Figure NGL.3 by orange squares marked with an ‘M’. In total, western Canada has about 150 gas resource groupings, each with its own set of monthly production and annual gas compositions.
Figure NGL.3: Western Canada area and grouping map
Source and Description
Source: CER
Description: This map shows the natural gas groupings in western Canada. The groupings are categorized by area (geographic location), conventional, tight, shale, coalbed methane, and solution gas types (by shape and colour); and by shallow to deep zones (lighter to darker for each colour).
Gas compositions
Compositions for each grouping are calculated by well year. In other words, wells in a grouping are also grouped by year. These gas compositions are production-weighted averages of gas-analysis data for wells in each grouping for each year.
Molar compositionsDefinition* (from the gas-analysis data) lead to NGL production per marketable natural gas production (barrels per million cubic feet, or b/MMcf). Gas plant recovery factors, by year, determine how much of the NGLs in the gas are produced, because not all NGLs can be recovered. Further details on gas plant recovery factors are below. Annual NGL ratios by grouping are available to download as an excel file from the bottom of the EF2023 Data Supplement page.
EthaneDefinition*, propaneDefinition*, butaneDefinition*, and pentanes plusDefinition* are processed in plants. Liquid condensate (condensate) is recovered at the wellhead and is not produced from all wells, or from all areas. Table NGL.1 is an example of the condensate ratios for particular areas and types of gas. Note that the ratios apply to Montney tight groupings, Duvernay shale groupings, and both the conventional and tight Cretaceous groupings in the listed areas. For current ratios see the NGL Supplement data available to download as an excel file from the bottom of the EF2023 Data Supplement page.
Table NGL.1: Western Canada condensate ratios at the wellhead
| Formation | Province | Petrocube Area | Area | Year 1 | Year 2 | Year 3 | Year 4 | Year 5 | Year 6 | Year 7 | Year 8 | Projected years |
|---|---|---|---|---|---|---|---|---|---|---|---|---|
| Montney | AB | Peace River | 11 | 10 | 10 | 10 | 10 | 20 | 30 | 50 | 50 | 50 |
| Montney | AB | Kaybob | 8 | 10 | 10 | 10 | 10 | 20 | 30 | 50 | 100 | 100 |
| Montney | AB | Alberta Deep Basin | 9 | 10 | 10 | 10 | 10 | 20 | 30 | 50 | 100 | 100 |
| Montney | AB | West Central Alberta | 6 | 10 | 10 | 10 | 10 | 20 | 30 | 50 | 100 | 100 |
| Montney | AB | Central Foothills | 7 | 5 | 10 | 15 | 20 | 25 | 30 | 35 | 40 | 50 |
| Montney | BC | Fort St. John | 14 | 10 | 10 | 10 | 10 | 10 | 10 | 15 | 25 | 25 |
| Montney | BC | BC Deep Basin | 13 | 0 | 0 | 0 | 0 | 0 | 0 | 0 | 0 | 0 |
| Montney | BC | BC Foothills | 16 | 5 | 5 | 5 | 5 | 5 | 5 | 5 | 5 | 5 |
| Duvernay | AB | Alberta Deep Basin | 9 | 10 | 10 | 10 | 10 | 10 | 10 | 10 | 10 | 10 |
| Duvernay | AB | Kaybob | 8 | 450 | 450 | 450 | 450 | 450 | 450 | 450 | 450 | 450 |
| Duvernay | AB | West Central Alberta | 6 | 450 | 450 | 450 | 450 | 450 | 450 | 450 | 450 | 450 |
| Cretaceous | AB | Peace River | 11 | 5 | 5 | 5 | 5 | 5 | 5 | 5 | 5 | 5 |
| Cretaceous | AB | Kaybob | 8 | 12 | 12 | 12 | 12 | 12 | 12 | 12 | 12 | 12 |
| Cretaceous | AB | Alberta Deep Basin | 9 | 10 | 10 | 10 | 10 | 10 | 10 | 10 | 10 | 10 |
| Cretaceous | AB | West Central Alberta | 6 | 15 | 15 | 15 | 15 | 15 | 15 | 15 | 15 | 15 |
| Cretaceous | AB | Central Foothills | 7 | 5 | 5 | 5 | 5 | 5 | 5 | 5 | 5 | 5 |
| Other | Any | Any | Any | 0 | 0 | 0 | 0 | 0 | 0 | 0 | 0 | 0 |
Source
Source: CER
Modelled production versus provincial reported production
AlbertaFootnote 2 and B.C.Footnote 3 provincial governments report NGL production in each of their respective provinces on their external websites.Footnote 4 Reported volumes are NGLs processed in the gas plants/straddle plantsDefinition*/fractionatorsDefinition* located in each of the provinces. CER-modeled NGL production is based on gas production from each grouping. Thus, CER-modeled NGL production by province is based on where the natural gas production (where the natural gas and NGLs come out of the ground) occurs instead of where the natural gas is processed. Since some natural gas production in B.C. flows to Alberta and is processed in Alberta, there are differences between each of the provincial estimates of NGL production and CER-modeled NGL production.Footnote 5 Also, some natural gas from western Canada is piped to Ontario and processed in Ontario. However, total modeled NGL production is intended to equal total provincial (Alberta government, plus B.C. government, plus CER’s estimate for Ontario) reported production.
For each NGL for each historical month:
B.C.CER + ABCER = B.C.B.C.gov + ABAER + ONestimate
Ethane potential and production
The majority of ethane is extracted at large gas-processing facilities located on major natural gas pipelines in Alberta and B.C. Since demand for ethane depends on the capacity of petrochemical facilities in Alberta and Ontario using it as a feedstock, and because some ethane is imported from the U.S. by pipeline, not all potentially recoverable ethane (ethane in the natural gas) becomes production. Ethane surplus to demand is reinjected back into the gas stream and is not recovered. Ethane production plus ethane not recovered is called ethane potential. Ethane potential is calculated by multiplying the gas composition of ethane by natural gas production and a recovery factor (estimate of the percent that is recovered instead of being left in the natural gas), as described in the gas compositions section above.
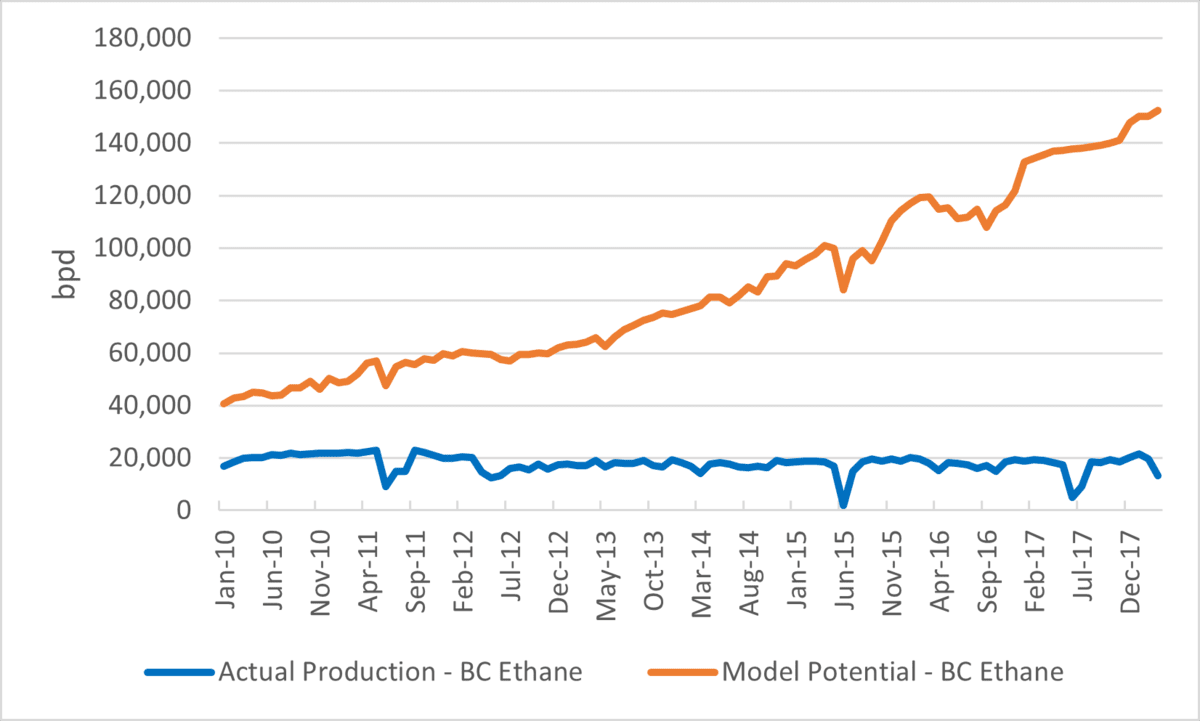
Modeled ethane potential in B.C. is much larger than reported ethane production, as expected. Reported production is ethane production from processing facilities in B.C., and thus does not include the ethane that is not recovered and ethane in gas that flows to processing facilities in Alberta, where some of the ethane is then recovered (see Figure NGL.6 in this section).
Figure NGL.4: B.C. ethane potential
Source and Description
Source: CER, B.C. government
Description: This line chart compares actual B.C. ethane production (bottom blue line) from the B.C. provincial government vs CER modeled B.C. potential ethane production (upper red line) from 2010 to 2022.
Modelled ethane potential in Alberta is different than actual production as reported by the Alberta Energy Regulator (AER), even though the lines are coincidentally close, as can be seen in Figure NGL.5. Modelled potential includes ethane production and ethane not recovered. AER-reported production includes ethane processed in Alberta from natural gas produced in B.C. and does not include ethane not recovered. To compare actual and modelled production for western Canada–to see if the model is calculating historical ethane potential and production accurately–B.C. and Alberta numbers are summed together.
Figure NGL.5: Alberta ethane potential
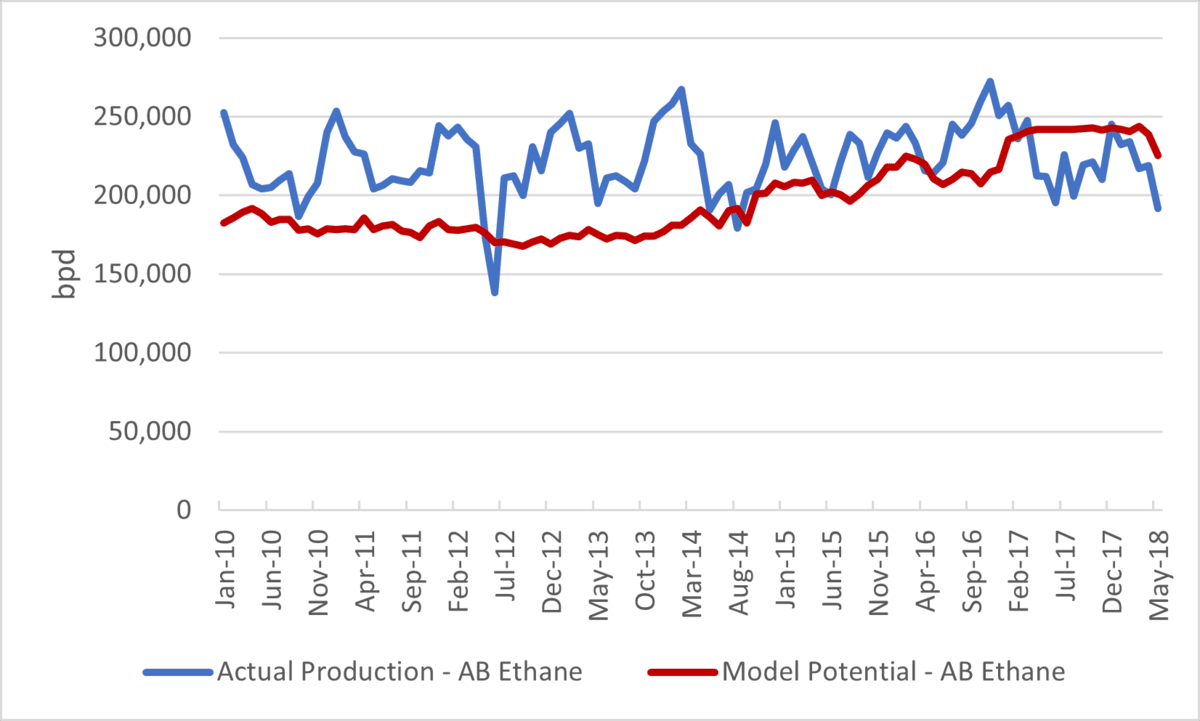
Source and Description
Source: CER and AER
Description: This line chart compares actual AB ethane production (blue line with larger month-to-month variations) from the AER vs CER modeled AB potential ethane production (red line with smaller month-to-month variations) from 2010 to 2022.
Figure NGL.6: Alberta and B.C. ethane potential
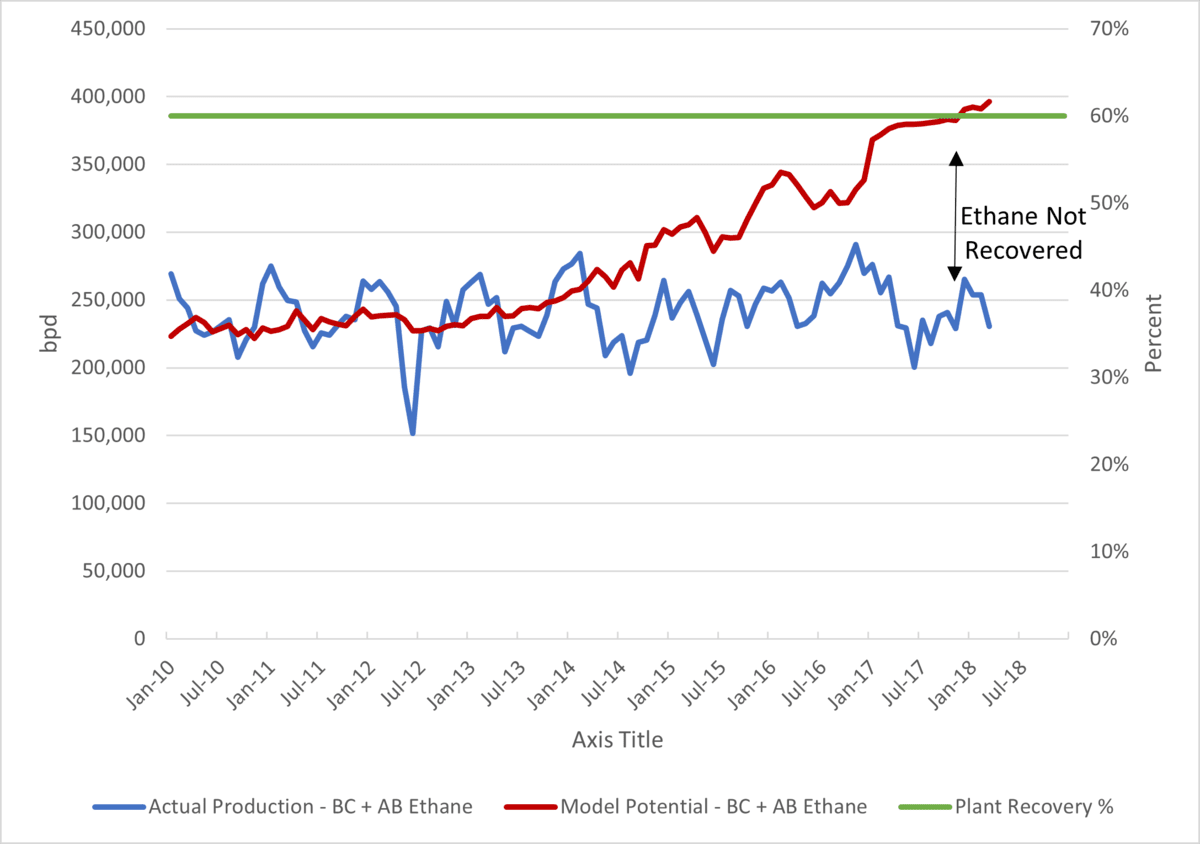
Source and Description
Source: CER, B.C. government, and AER
Description: This line chart compares actual ethane production reported by the provincial governments and CER modeled ethane potential (which trends similarly to production until 2014, and then gradually grows higher). This gap is ethane not recovered from the gas stream. Plant recovery fraction (right axis) of 0.6 or 60% is the upper flat line shown for context.
Propane production
Propane is extracted at gas-processing facilities located in Alberta, B.C., and Ontario, and is also a by-product of refineries and oil sands upgrading. Modeled propane production in B.C. is larger than reported propane production, as expected. Reported production is propane production from processing facilities in B.C. Some natural gas produced in B.C. flows to processing facilities in Alberta, where the propane is produced.
Modelled propane production in Alberta is lower than the AER’s reported production. AER reported production includes propane processed in Alberta from natural gas produced in B.C. Alberta actual production also includes propane processed in Ontario from NGL mixes shipped from Alberta to Eastern Canada,Footnote 6 which are included in modelled production for Alberta.
With a 90% recovery factor, actual production, and modelled production for western Canada are very similar and the modelled production is a good fit for actual production. Assumed recovery factors and compositions are carried forward over the projection.
Butane production
Butane is extracted at gas-processing facilities located in Alberta, B.C., and Ontario, and is also a by-product of refineries and oil sands upgrading. Modeled butane production in B.C. is larger than reported butane production, as expected. Reported production is butane production from processing facilities in B.C. Some natural gas produced in B.C. flows to processing facilities in Alberta, where the butane is produced, and is not included in the B.C. government estimates.
Modelled butane production in Alberta is lower than AER reported production. AER actual production includes butane processed in Alberta from natural gas produced in B.C. Alberta actual production also includes butane processed in Ontario from NGL mixes produced in western Canada,Footnote 7 which are included in the modeled production for Alberta.
With a 95% to 99% recovery factor, actual production and modelled production for western Canada are very similar. The assumed recovery factors and compositions are carried forward over the projection.
Pentanes plus and condensate production
Most condensateDefinition* production comes from gas production at wellheads. Pentanes plusDefinition* production comes from processing natural gas produced in B.C. and Alberta, and as a by-product from refineries. Differences in actual production and modelled production for each province will occur because some of B.C.’s natural gas production is processed in Alberta, but also because different government agencies define pentanes plus and condensate differently.
The B.C. government categorizes pentanes plus and condensate similar to how the CER model categorizes them. Further, unlike for ethane, propane, and butane, condensate volumes in B.C. are from condensate production at wellheads, which means it has not flowed into Alberta to be processed and reported there.
Alberta has large differences between actual and modelled production for both pentanes plus and condensate. This is especially true since liquids-rich tight gas plays such as the Montney Formation and condensate-rich Duvernay shale gas increase NGL content. The AER and CER categorize pentanes plus and condensate differently, and increased condensate production at wellheads in the Montney Formation and Duvernay Shale leads to the large differences. A significant amount of Alberta condensate production is included in the AER’s reported pentanes plus production, whereas modelled production categorizes it all as condensate.
Summing pentanes plus and condensate production for each province shows a much closer match between actual and modelled production. Further, pentanes plus is mostly processed in the province where the gas is produced, or as condensate at wellheads. Both Alberta and B.C. show close fits for modeled and reported production. Assumed compositions and a recovery factor of 100% for both pentanes plus and condensate are carried forward over the projection.
Other NGL production
Most NGL production in Canada comes from processing natural gas from B.C. and Alberta. There are also other sources of NGLs.
Upgrading bitumen produces ethane, propane, and butane as by-products. Projected NGL production from upgrading is based on the oil sands production model, while historical production is based on ratios of NGL production and upgrading volumes.
Propane, butane, and pentanes plus are also produced as a by-product from refining and are often referred to as Liquefied Petroleum Gas (LPG). Propane, butane, and pentanes plus production from Canadian refineries is based on the refinery projection for each scenario in EF2023 analysis.
A small amount of pentanes plus production has, and will continue to be estimated for Saskatchewan.
A small amount of pentanes plus production occurred in Nova Scotia from its offshore gas production facilities. Both Sable and Deep Panuke ceased operations in 2018, and so too did their pentanes plus production.
NGL supply and disposition
Historical levels and projections of NGL supply and dispositions are available to download as an excel file from the bottom of the EF2023 Data Supplement page. This section briefly summarizes the supply and disposition assumptions.
Supply = production + imports
Production of each NGL was discussed previously. Besides domestic production, other sources of NGL supply are imports. Projected imports of ethane from the United States (U.S.) are based on Canadian petrochemical demand. Imports of propane and butane from the U.S. into Alberta and Ontario are minimal and are based on current trends and any applicable assumptions for a given scenario. Imports of pentanes plus and condensate are based on diluent demand.
Disposition = demand + exports
Projections of domestic demand of NGL are based on the demand analysis, which includes factors like GDP growth, population growth, industrial use, end-use technology changes, and more. Historical exports of NGLFootnote 8 are found on the Commodity Statistics page of the CER website. Projected exports of NGL are based on balancing supply and disposition, and are discussed in the Energy Demand and Emission section.
Supply and disposition balance
Historical supply and disposition by year for each NGL are fairly close. The differences are called adjustments. For the projection period, however, exports and/or imports are adjusted so that total supply equals total disposition for each year for propane, butane, and pentanes plus and condensate. For propane, exports are adjusted. For butane, exports are adjusted. For pentanes plus and condensate, the difference between production and demand for a year is either a net export if production is larger than demand, or a net import if demand is larger than production.
Ethane balancing is different. Since it is assumed there are no exports, and imports of ethane are based on petrochemical demand for ethane projections, the amount of ethane not recovered is adjusted so that supply and disposition balance each year of the projection.
- Date modified: