ARCHIVED – Executive Summary
This page has been archived on the Web
Information identified as archived is provided for reference, research or recordkeeping purposes. It is not subject to the Government of Canada Web Standards and has not been altered or updated since it was archived. Please contact us to request a format other than those available.
The National Energy Board’s (NEB) Energy Futures series explores how possible energy futures might unfold for Canadians over the long term. This analysis is not a prediction of what will take place, nor does it aim to achieve certain goals like Canada’s climate targets. Rather, Energy Futures employs economic and energy models to make projections based on a certain set of assumptions given past and recent trends related to technology, energy and climate policies, human behaviour, and the structure of the economy.
Canada’s Energy Future 2017 – Supply and Demand Projections to 2040 (Energy Futures 2017) considers three cases:
- The Reference Case is based on a current economic outlook, a moderate view of energy prices, and climate and energy policies announced at the time of analysis.
- The Higher Carbon Price Case considers the impact on the Canadian energy system of higher carbon pricing than in the Reference Case.
- The Technology Case considers, in addition to higher carbon prices, the impact on the Canadian energy system of greater adoption of select emerging production and consumption energy technologies.
Key Findings
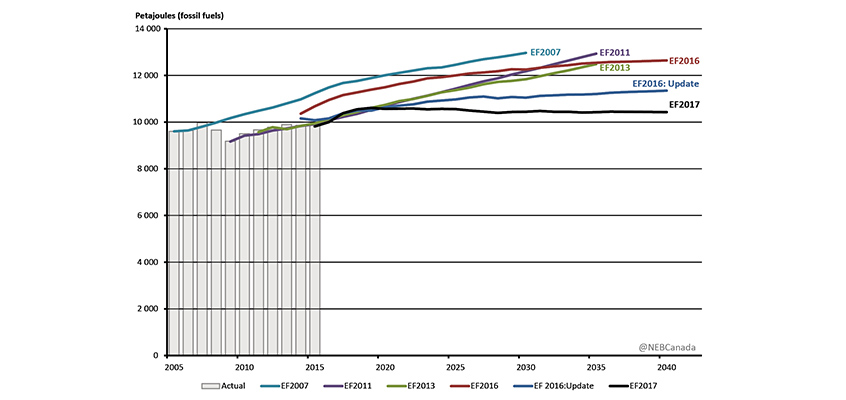
Key Finding 1: The Energy Futures 2017 Reference Case is the first baseline projection in the Energy Futures series* where fossil fuel consumption peaks within the projection period.
Fossil fuel use in Canada peaks early in the Reference Case projection. Improving energy efficiency, somewhat slower economic and population growth projections than in previous outlooks, and climate change policies introduced by various federal and provincial governments underlie this change in trajectory.
* The series of reports entitled Energy Futures commenced in 2007.
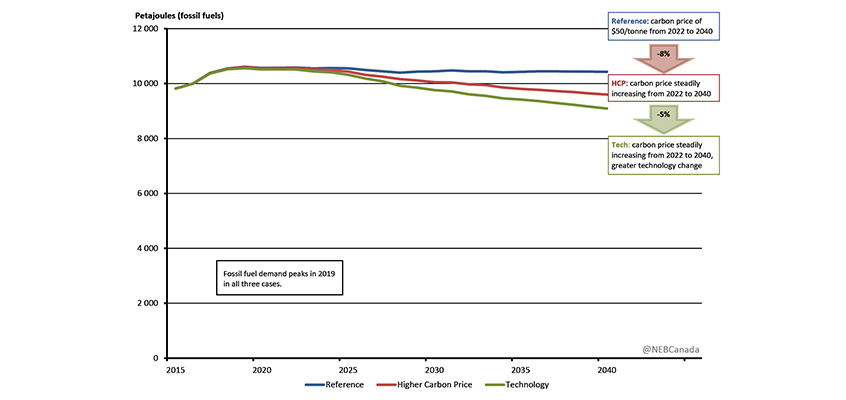
Key Finding 2: Canadian fossil fuel consumption in the Higher Carbon Price Case is 8% lower than in the Reference Case, and 13% lower in the Technology Case by 2040.
Climate policies and the pace of technological development will drive future energy use trends. In the Higher Carbon Price Case fossil fuel use is 8% lower compared to the Reference Case as Canadian households and businesses become more energy efficient. In the Technology Case, greater use of emerging energy technologies results in fossil fuel use that is 5% lower than in the Higher Carbon Price Case and 13% below the Reference Case.
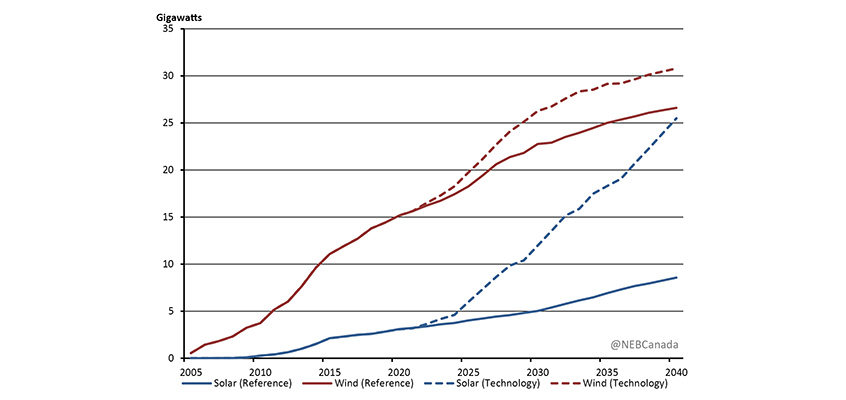
Key Finding 3: Renewable capacity grows quickly, with wind doubling and solar more than tripling by 2040 in the Reference Case.
Canada’s already low emitting electricity sector continues to get greener. Solar capacity increases from just over 2 GW in 2015 to over 8 GW in 2040 in the Reference Case. Lower solar costs result in even greater growth in solar in the Technology Case, with capacity reaching 25 GW in 2040. Wind capacity increases from 11 GW in 2016 to over 26 GW by 2040 in the Reference Case, and nearly 31 GW in the Technology Case. In all cases, traditional coal-fired capacity falls considerably and is replaced by a combination of renewables, natural gas and coal equipped with carbon capture and storage technology. By 2040, 82% of generation in Canada is from non-emitting sources in the Reference Case, and 86% in the Technology Case, compared to 80% in 2016.
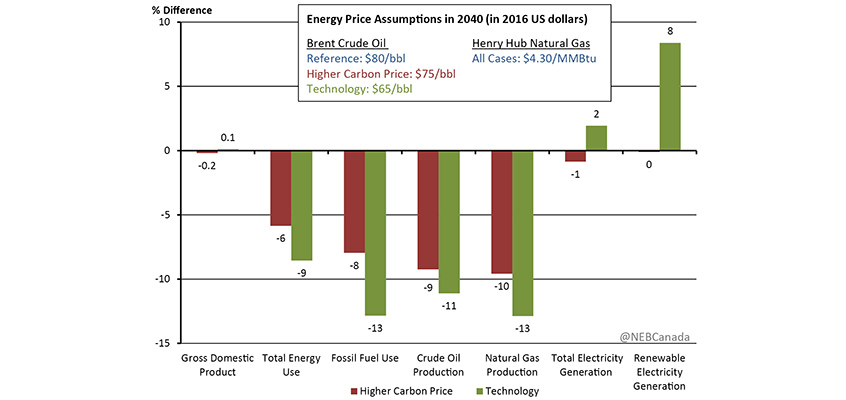
Key Finding 4: Despite different energy outcomes, economic growth is similar in all three scenarios in Energy Futures 2017.
Gross domestic product, a measure of the size of the economy, is 0.2% lower in the Higher Carbon Price Case than in the Reference Case, and 0.1% higher in the Technology Case, in 2040. In a scenario where other nations are also increasing the strength of their climate policies, higher carbon prices reduce fossil fuel consumption and have a limited impact on economic growth.
Key Finding 5: Future policies and technology trends, both domestically and globally, will shape Canada’s sustainable energy future.
In the Higher Carbon Price and Technology cases, fossil fuel use and GHG emissions in 2040 are less than current levels, while the share of renewable and other non-emitting fuels increases. These cases illustrate the ability of policies and technologies to bend the energy use trajectory. The analysis in Energy Futures 2017 presents projections of future energy demand and supply under various assumptions, and is not a pathway to meet specific climate goals or targets. While the results suggest more action will be needed to meet Canada’s GHG emission targets, the cases in Energy Futures 2017 do not represent a ceiling on Canada’s potential for GHG emission reductions. Rather, the cases illustrate the impact climate policy and technology can have on Canada’s energy system.
Key Finding 1 Description
This graph compares projected annual fossil fuel consumption by each Reference Case in EF2007, EF 2011 EF2013, EF2016, EF2016:Update and EF2017. These cases are also compared to columns displaying historical demand from 2005 to 2016. EF2007 slopes upward and projects a demand of 12967 PJ in 2030. EF2011 and EF2013 follow the same trend, projecting fossil fuels consumption of 12 935 PJ and 12 484 PJ in 2035. EF2016 and EF2016:Update also increase until their end points in 2040, finishing at 12 645 PJ and 11 350 PJ. EF2017 shows peak demand occurring in 2019 at 10 611 PJ then decreasing to 10 429 PJ in 2040.
Key Finding 2 Description
This graph compares fossil fuel use in the Reference Case, HCP Case and Technology Case. The Reference Case ends in 2040 with 10 429 PJ of demand. The HCP Case predicts an 8% lower fossil fuel demand compared to the Reference case with 9 599 PJ in 2040. Additionally the Technology Case sits 5% lower than the HCP Case with 9 089 PJ in 2040. All three cases forecast peak demand in 2019.
Key Finding 3 Description
This graph compares the growth of solar and wind capacity between the Reference and Technology cases. The two cases see similar uptake until 2022, after which the Technology Case begins to grow faster for both wind and solar. Solar in the Technology Case increases to 25.49 GW in 2040 and the Reference Case reaches 8.57 GW. Wind in the Technology Case increases to 30.79 GW in 2040 and the Reference Case reaches 26.60 GW.
Key Finding 4 Description
This chart compares the relative difference between the HCP and Technology cases to the Reference Case on a variety on measures through 2040. The energy price assumptions are Brent Crude Oil prices are predicted to be $80/barrel in the Reference Case, $75/barrel in the HCP Case and $65/barrel in the Technology Case in 2040. The Henry Hub Natural Gas price is expected to be $4.30/MMBtu for all cases. GDP is expected to be 0.2% lower in the HCP Case and 0.1% higher in the Technology Case compared to the Reference Case. Total energy use is expected to be 6% lower in the HCP Case and 9% lower in the Technology Case compared to the Reference Case. Fossil fuel use is expected to be 8% lower in the HCP Case and 13% lower in the Technology Case compared to the Reference Case. Crude oil production is expected to be 9% lower in the HCP Case and 11% lower in the Technology Case compared to the Reference Case. Natural gas production is expected to be 10% lower in the HCP Case and 13% lower in the Technology Case compared to the Reference Case. Total electricity generation is expected to be 1% lower in the HCP Case and 2% higher in the Technology Case compared to the Reference Case. Renewable electricity generation is expected to be unchanged in the HCP Case and 8% higher in the Technology Case compared to the Reference Case.
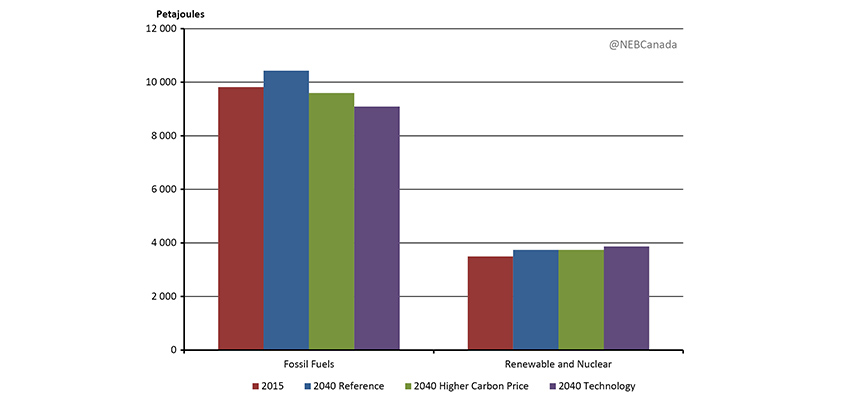
Key Finding 5 Description
This chart shows the energy use changes in fossil fuels, nuclear and renewables between 2015 and 2040 for each EF2017 scenario. In 2015 fossil fuel energy use was 9 818 PJ. By 2040, the Reference Case energy use is 10 429 PJ, the HCP Case energy use is 9 599 PJ, and the Technology Case energy use is 3 868 PJ. In 2015 renewable and nuclear energy use totaled 3 497 PJ. By 2040, the Reference case energy use is 3 740 PJ, the HCP Case energy use is 3 741 PJ, and in the 2040 Technology Case it is 3 868 PJ.
- Date modified: