ARCHIVED – Canada’s Energy Future 2018 Supplement: Conventional, Tight, and Shale Oil Production
This page has been archived on the Web
Information identified as archived is provided for reference, research or recordkeeping purposes. It is not subject to the Government of Canada Web Standards and has not been altered or updated since it was archived. Please contact us to request a format other than those available.
Canada’s Energy Future 2018 Supplement: Conventional, Tight, and Shale Oil Production [PDF 1581 KB]
Report Data and Figures [EXCEL 7599 KB]

May 2019
Copyright/Permission to Reproduce
ISSN 2369-1476
Table of Contents
Chapter 1: Background
The National Energy Board’s (NEB) Energy Futures (EF) series explores how possible energy futures might unfold for Canadians over the long term. EF analyses consider a range of impacts across the entire Canadian energy system. In order to cover all aspects of Canadian energy in one supply and demand outlook, the extensive crude oil, natural gas, and natural gas liquids (NGL) production analyses are described at a relatively high level. A series of supplemental reports is able to address impacts specific to the supply sector, creating an opportunity to provide additional detail.
Future oil prices are a key driver of future oil production and a key uncertainty to the projections in the Canada’s Energy Future 2018: Energy Supply and Demand Projections to 2040 (EF2018). Crude oil prices could be higher or lower depending on demand, technology, geopolitical events, and the pace at which nations enact policies to reduce GHG emissions.
EF analysis assumes that, over the long term, all energy produced will find markets. In the near–term, a lack of available pipeline export capacity was accounted for in the price assumptions for western Canadian crudes. The timing and extent to which particular markets emerge, whether demand growth over/undershoots local production, whether export/import opportunities arise, and whether new transportation infrastructure is built, is difficult to predict. This is why simplified assumptions are made. The analysis in this supplemental report continues the EF tradition of assuming these short–term disconnects are resolved over the longer term.
The EF series of Natural Gas, Crude Oil, and NGL supplement reports include four EF cases.
Table 1.1 EF2018 Natural Gas and Crude Oil Production Assumptions/Cases
| Variables | Reference | High Price | Low Price | Technology |
|---|---|---|---|---|
| Oil Price | Moderate | High | Low | Moderate |
| Gas Price | Moderate | High | Low | Moderate |
| Carbon Price | Fixed nominal C$50/t | Fixed nominal C$50/t | Fixed nominal C$50/t | Increasing CO2 cost reaching nominal C$336/t in 2040 |
| Technology Advances | Reference assumption | Reference assumption | Reference assumption | Accelerated |
| Notes | Based on a current economic outlook and a moderate view of energy prices | Since price is one of the most influential factors in oil and gas production, and does vary over time, these two cases look at the effects of significant price differences on production | Considers the impact of greater adoption of select emerging energy technologies on the Canadian energy system, including technological advances in oil sands production; and the impact on the Canadian energy system of higher carbon pricing | |
This Canadian conventional, tight, and shale oil productionFootnote 1 supplemental report includes a detailed look at the Reference Case, followed by results from the other three cases. The acceleration in technological advances that applies to energy supply in the technology cases is a focus on advancements in solvent use oil sands production technologies with no changes to other oil production technology assumptions. Oil price assumptions in the High Price Case and Low Price Case differ significantly from the other four cases.
The Appendix includes a description of the methods and assumptions used to derive the production projections, and detailed data sets for all cases—including annual wells drilled, production decline curve parameters, and monthly production, all by grouping. The Appendix is available in this document, and the data from the Appendix and chart data in this supplemental report is available [EXCEL 7599 KB].
Chapter 2: Reference Case
2.1 Conventional, Tight and Shale Oil Production by Province
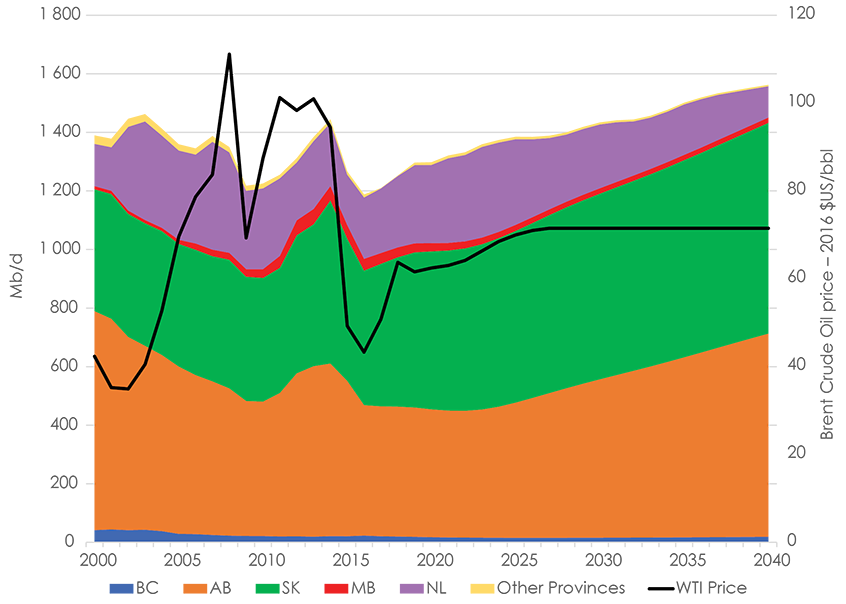
- Figure 2.1 shows production by province in the Reference CaseFootnote 2Oil prices have been significantly lower in the last couple of years compared to 2010 to 2014. This has lead to a decline in total production. Starting in 2018, prices are expected to gradually increase and reach US$75/bbl in 2027 for West Texas Intermediate (WTI) crude. Western Canadian industry activity will pick up as oil prices rise and this will eventually lead to production increasing, as production added from new wells starts to outpace declining production from existing wells. Production in western Canada in 2017 was 157 thousand cubic metres per day (10³m³/d) or 0.99 million barrels per day (MMb/d) and by 2040 it will be 47% higher at 231 10³m³/d (1.45 MMb/d).
Figure 2.1 Reference Case Non–Oil Sands Production and Price
Description:
This graph breaks down the Reference Case projection for Canadian conventional, tight, and shale oil production by province, and also includes the WTI crude oil price. British Columbia oil production is projected to decrease from 21.07 Mb/d in 2017 to 19.22 Mb/d in 2040. Alberta production is projected to increase from 443.55 Mb/d in 2017693.69 Mb/d in 2040. Saskatchewan is projected to increase from 486.73 Mb/d in 2017 to 719.69 Mb/d in 2040. Manitoba is projected to decrease from 36.67 Mb/d in 2017 to 18.15 Mb/d in 2040. Newfoundland is projected to decrease from 220.75 Mb/d in 2017 to 106.87 Mb/d in 2040. Production for the rest of Canada is projected to change from 9.96 Mb/d in 2016 and 0.93 Mb/d in 2017 to 4.72 Mb/d in 2040. Total Canadian production is projected to increase from 1209.71 Mb/d in 2017 to 1562.35 Mb/d in 2040. The WTI crude oil price, in 2016 U.S. dollars per barrel, is projected to increase from $50.80 in 2017 to $71.50 in 2027 and remain at $71.50 to the end of 2040.
- 2016 was the first year that Saskatchewan production surpassed Alberta non–oil sands production. This continues over the projection period and, by 2040, Saskatchewan makes up 50% of total western Canadian production. Saskatchewan production growth largely comes from thermal heavy oil projects (section 2.3 provides more details).
- British Columbia (B.C.) and Manitoba produce minor amounts of both conventional and tight oil. The provincial breakdowns are in the next section.
- Conventional oil is produced elsewhere in Canada. Newfoundland and Labrador offshore oil production increases steadily over the next five years as the Hebron project begins production and additional wells are brought online at existing facilities. After peaking at 49 10³m³/d (310 Mb/d) by 2023, production begins to decline as operating fields mature. The Reference Case assumes that two generic offshore discoveries add new production starting in 2028 and 2034. Northern Canada and Ontario oil production continues to trend down over the projection period. Nova Scotia condensate production ends in 2020 in this report, as the existing offshore production platforms are decommissioned.
2.2 Western Canadian Production by Province, Class, and Type of Oil
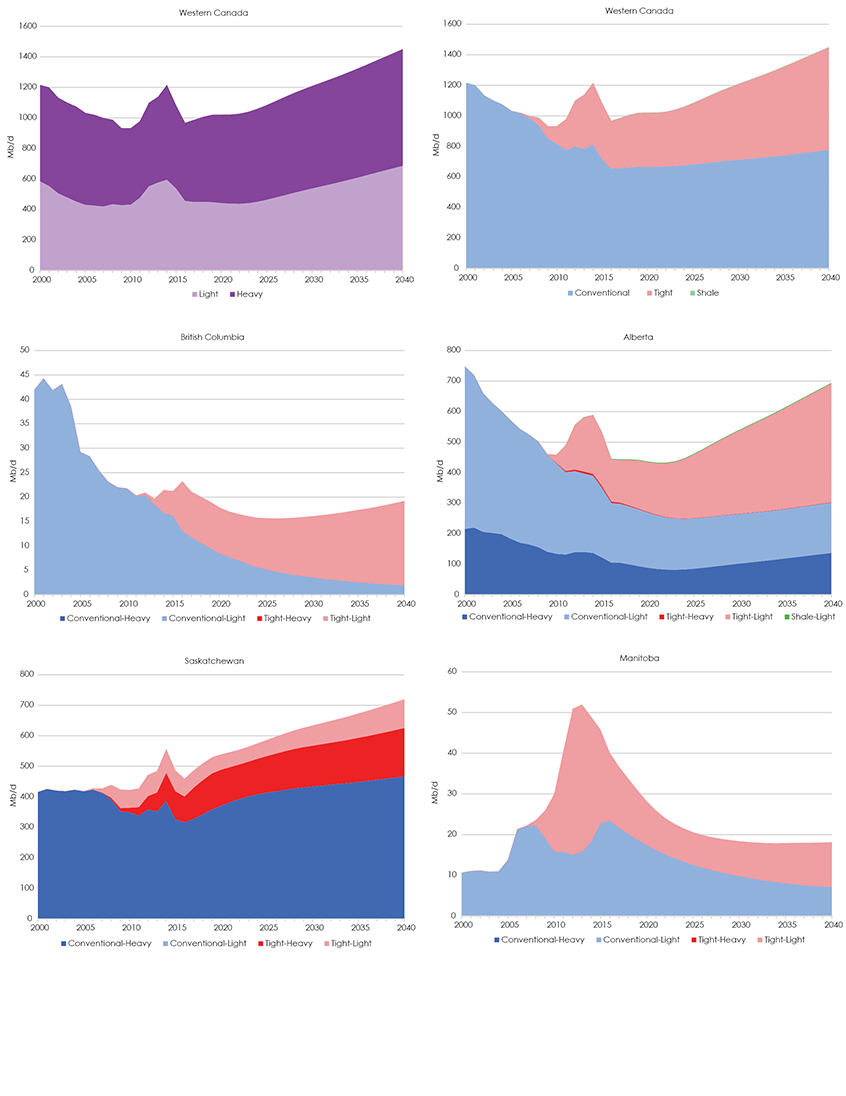
- Since 2000, Western Canadian, non–oil sands oil production ranged from 49% to 58% heavy, with the remainder lightFootnote 3. In 2017, heavy oil made up 54% of production and is projected to climb to 58% in 2023 with the ramp–up of Saskatchewan thermal heavy oil projects. Heavy oil production then drops down to 53% by 2040 as production from those projects level off and growth in light oil outpaces growth in heavy oil. Both heavy and total light oil production grow over the projection period after 2020, as well as conventional, tight, and shale productionFootnote 4. However, there are differences for each province.Footnote 5
- Northeastern B.C. production is all light oil, with conventional oil making up the majority. While B.C. has substantial shares of Canadian natural gas production and resources (see Canada’s Energy Future 2018 Supplement: Natural Gas Production), it does not have a significant amount of oil production.
- The majority of non–oil sands production in Alberta has and will continue to be light oil. Most of the production growth over the projection period is from west–central parts of the province. As horizontal drilling and multi–stage hydraulic fracturing advanced over the last decade, tight oil production increased and will continue to make up a larger share. In 2017, conventional oil made up 67% of non–oil sands production in Alberta. By 2040 that share drops to 54%, with tight oil’s share increasing to 46%.
- Heavy, conventional oil makes up the majority of Saskatchewan production and grows substantially over the projection period, given projected thermal heavy oil growth (see section 2.3). Tight oil production will also continue in Saskatchewan because of tight oil development in the southwest and southeast parts of the province.
- Manitoba production is entirely light oil. Manitoba light, tight oil production peaked in 2012 and 2013, and has since declined. However, it will increase slightly later in the projection period as prices rise and stay high enough for new production to outpace production declines from existing wells. Conventional oil production will decline over the projection period.
Figure 2.2 Reference Case Production by Class, Type, and Province
Description:
This graph breaks down the Reference Case projection for western Canadian conventional, tight, and shale oil production by province, by class of oil, and by type of oil. Total western Canada light oil production is projected to increase from 449.72 Mb/d in 2017 to 686.70 Mb/d in 2040. Total western Canada heavy oil production is projected to increase from 538.31 Mb/d in 2017 to 764.06 Mb/d in 2040. Total western Canada conventional oil is projected to increase from 659.72 Mb/d in 2017 to 777.70 Mb/d in 2040. Total western Canada tight oil production is projected to increase from 326.17 Mb/d in 2017 to 671.11 Mb/d in 2040. Total western Canada shale oil production is projected to decrease from 2.13 Mb/d in 2017 to 1.95 Mb/d in 2040. British Columbia light conventional oil is projected to decrease from 11.78 Mb/d in 2017 to 1.96 Mb/d in 2040. British Columbia light tight oil is projected to increase from 9.29 Mb/d in 2017 to 17.26 Mb/d in 2040. Alberta heavy conventional oil is projected to increase from 104.85 Mb/d in 2017 to 137.05 Mb/d in 2040. Alberta heavy tight oil is projected to decrease from 3.36 Mb/d in 2017 to 1.34 Mb/d in 2040. Alberta light conventional oil is projected to decrease from 193.13 Mb/d in 2017 to 164.44 Mb/d in 2040. Alberta light tight oil is projected to increase from 140.08 Mb/d in 2017 to 388.91 Mb/d in 2040. Alberta light shale oil is projected to decrease from 2.13 Mb/d in 2017 to 1.95 Mb/d in 2040. Saskatchewan heavy conventional oil is projected to increase from 328.18 Mb/d in 2017 to 467.12 Mb/d in 2040. Saskatchewan heavy tight oil is projected to increase from 101.92 Mb/d in 2017 to 158.55 Mb/d in 2040. Saskatchewan light conventional oil is around 0.01 Mb/d. Saskatchewan light tight oil is projected to increase from 56.63 Mb/d in 2017 to 94.02 Mb/d in 2040. Manitoba light conventional oil is projected to decrease from 21.78 Mb/d in 2017 to 7.12 Mb/d in 2040. Manitoba light tight oil is projected to decrease from 14.90 Mb/d in 2017 to 11.03 Mb/d in 2040.
2.3 Saskatchewan Thermal and EOR Projects
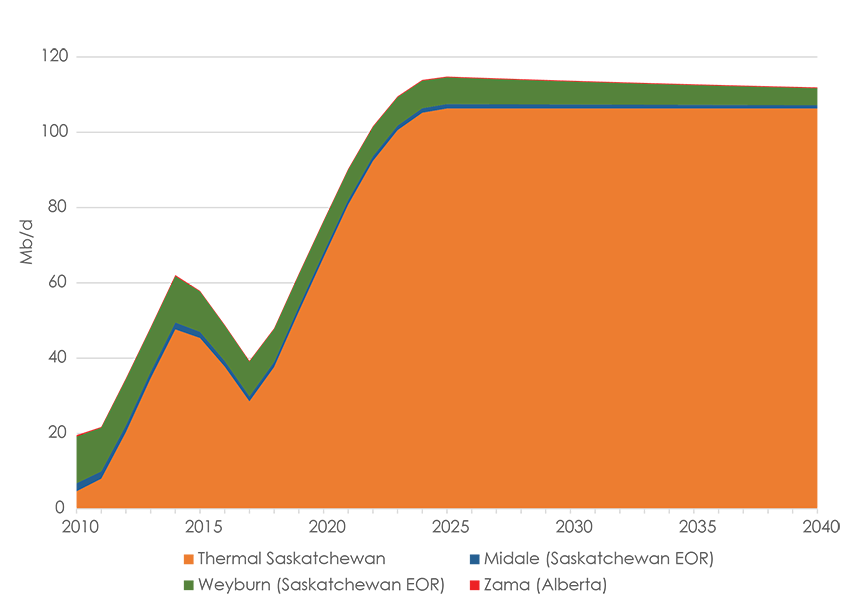
- Growth in Saskatchewan conventional, heavy oil production is from advancements in employing steam assisted gravity drainage recovery (SAGD) to heavy oil fields. There are currently 15 thermal heavy oil projects operating in Saskatchewan, a nearly threefold increase from 2012. Similar to the oil sands, production from these thermal projects does not exhibit the steep decline rates typical of traditional heavy oil wells. This generates revenues that enable ongoing capital expenditures and continued production growth over the projection period. Changes in market conditions, technology, or other factors could lead to production varying from this projection, especially for the later years.
- Enhanced Oil Recovery (EOR) methods have long been used in Saskatchewan for secondary extraction. Production from existing projects, such as the CO2 EOR projects currently operating in Weyburn and Midale, are starting to slowly taper off. This trend is expected to continue over the projection period.
Figure 2.3 Thermal and EOR Oil Projects
Description:
This graph shows the Reference Case production projection for Thermal and EOR in Saskatchewan and the Zama region of Alberta. Growth from this sector is largely due to increases in thermal oil production due to the application of SAGD technologies to conventional heavy oil reservoirs in the Lloydminster area of Saskatchewan. Thermal Saskatchewan production increases from 28.55 Mb/d in 2017 to 106.32 Mb/d in 2025 and stays level afterwards. Midale production decreases from 1.35 Mb/d in 2017 to 0.88 Mb/d in 2040. Weyburn production decreases from 9.20 Mb/d in 2017 to 4.51 Mb/d in 2040. Zama, in Alberta, increases from 0.16 Mb/d in 2017 to 0.20 Mb/d in 2019 and on.
2.4 Western Canada Average Days to Drill a Well and Initial Productivity
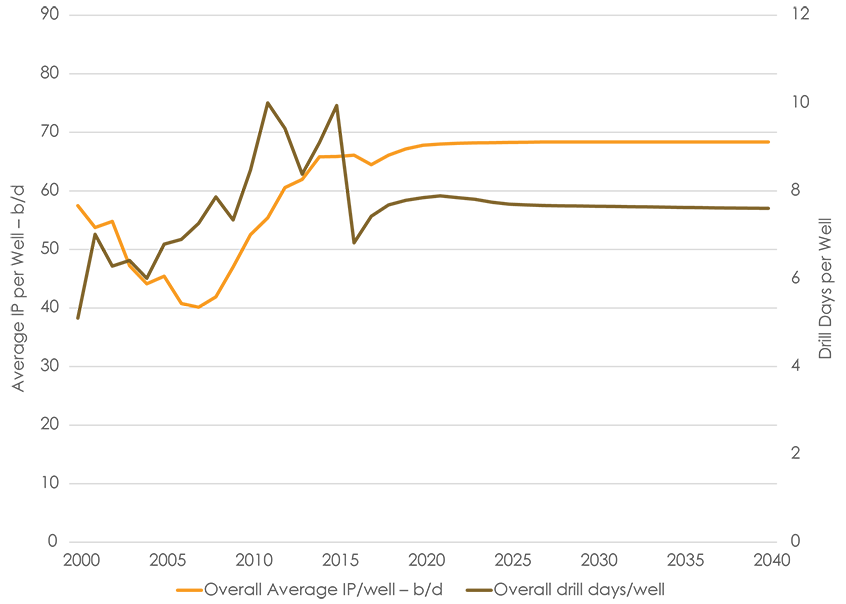
- Given the increased use of horizontal drilling and multi–stage hydraulic fracturing over the last decade, the average number of days to drill an oil wellFootnote 6 in western Canada has, for the most part, increased until recently. More complex well completions and additional drilling days increases the cost of the well. In 2006, it took an average of 6.9 days to drill and complete a well. This duration increased over the next few years, ranging from 8 to 10 days/well from 2011 to 2015. By 2017, the average decreased to 7.4 drill days per well for a number of reasons. Wells for thermal heavy oil projects in Saskatchewan typically take only a few days to drill. Also, drillers grew more efficient. The projected days per well stays fairly level over the projection period, where more thermal heavy oil development in Saskatchewan balances out with more conventional and tight drilling as oil price rises.Footnote 7
- Greater focus on developing tight oil has also increased the average initial production (IP) rate of wells in western Canada. The average IP was the lowest in 2007 at 40 bbl/d as many shallow, vertical wells were being drilled, which generally produce less oil than deeper wells. The average IP for all wells drilled in western Canada increased to 66 bbl/d by 2014. The average IP in 2017 was 64 bbl/d and rises early in the projection, reaching 68 bbl/d in 2020 and staying constant for the rest of the projection.Footnote 8
Figure 2.4 Western Canada Average Well IP and Drill Days per Well by YearFootnote 9
Description:
This graph includes the average initial production rate and average days to drill for all conventional, tight, and shale oil wells drilled in western Canada. The average IP for wells drilled in 2000 was 57 b/d. In 2017 the average was 64 b/d and is projected to increase to 68 b/d in 2040. The average days to drill a well in 2000 was 5.1. In 2017 the average was 7.4 days and is projected to increase slightly to 7.6 days in 2040.
Chapter 3: All Cases
- Production varies between the cases, especially for the High and Low Price cases. All cases have the same trend of focusing on tight oil resources and thermal heavy oil projects in Saskatchewan.
- In the Reference and High Price cases, production increases over the projection period. Production in the Low Price and Technology cases declines over the projection in the long term. In these two declining cases, oil prices are not high enough to enable sufficient revenues to fund capital expenditures to drill enough new wells to outpace production declines from older wells, and total production declines. In the Low Price Case, production drops to 85 10³m³/d (0.5 MMb/d) in 2040—a third of the production rate in the Reference Case.
- Production in the High Price Case reaches 416 10³m³/d (2.6 MMb/d) in 2040—twice as much as the Reference Case. This is largely from a compounding effect over the duration of the projection, where higher prices generate more revenue to enable more drilling and more production.Footnote 10 Projected production from thermal projects in Saskatchewan is also higher than in the Reference Case.
- In the Technology Case, higher carbon costs and lower crude oil prices result in conventional production falling in the long term, though not as much as in the Low Price Case.
- Offshore production in the Reference Case increases in the near term as Hebron continues to ramp up heavy oil production and new wells from existing facilities are brought online. Production peaks at 49 10³m³/d (309 Mb/d) in 2023 and declines through the projection thereafter, reaching 17 10³m³/d (107 Mb/d) in 2040. A new offshore discovery is assumed to add production in 2028, with a second new discovery in 2034. In the High Price Case new offshore production facilities are assumed to be constructed, supported by the increased price of crude oil. There are five fields of various sizes, two in the 2020s and three in the 2030s. Production in the High Price Case peaks at 57 10³m³/d (358 Mb/d) in 2024 and falls steadily thereafter reaching 21 10³m³/d (129 Mb/d) in 2040. In the Low Price Case there are no new discoveries assumed and production reaches a high of 47 10³m³/d (296 Mb/d) in 2023 and falls to 7 10³m³/d (56 Mb/d) by 2040.
Figure 3.1 Oil Price and Production Projections by Case
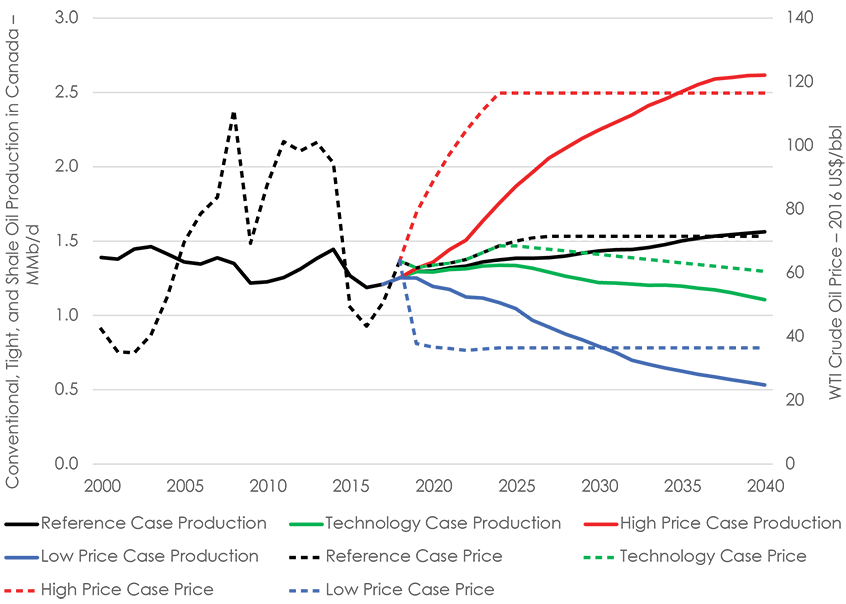
Description:
This graph shows the projections for Canadian conventional, tight, and shale oil production and WTI crude oil price for all four cases. The oil price is in 2016 US dollars per barrel. In the Reference Case price is projected to increase from $50.80 in 2017 to $71.50 in 2040, and production is projected in increase from 1.21 million b/d in 2017 to 1.56 million b/d in 2040. In the Technology Case oil price is projected to increase to $60.50 in 2040, and production is projected to decrease to 1.11 million b/d in 2040. In the High Price Case price is projected to increase to $116.50 in 2040, and production is projected to increase to 2.62 million b/d in 2040. In the Low Price Case price is projected to decrease to $36.50 in 2040, and production is projected to decrease to 0.53 million b/d in 2040.
Chapter 4: Considerations
- Oil prices are a key driver of future oil production and a key uncertainty to the projections in EF2018. Crude oil prices could be higher or lower depending on demand trends, technological developments, geopolitical events, and the pace at which nations enact policies to reduce GHG emissions.
- This analysis assumes that, over the long term, all energy production will find markets and infrastructure will be built as needed. However, in the near–term, a lack of available pipeline capacity impacts pricing of Canadian crude oil and the economics of production.
- The higher carbon price in the Technology Case assumes that global crude oil prices are lower than the Reference Case. This outcome is uncertain and depends on coordinated global climate action, the responsiveness of oil demand to higher carbon costs, and the availability of alternatives to existing technologies.
- Oil production depends on price, but also on recovery technology and drilling efficiency and costs. Should technology or costs advance differently than assumed, capital expenditures and well production projections would be different than modelled here.
- Thermal recovery of Saskatchewan’s heavy oil resources is a recent trend and future production growth is uncertain. Other technologies may also be adopted.
Appendix
Appendix A
Appendix A1 – METHODS (DETAILED DESCRIPTION)
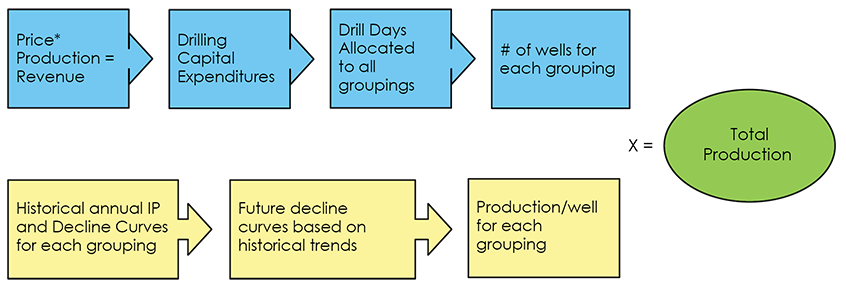
An oil production projection is the future production capability from a group of wells as determined by the production characteristics of each well, not accounting for reductions in actual production due to weather conditions, low oil prices, equipment failure, or other potential production interruptions. It equals the production capability of a well, multiplied by the expected number of wells. The oil price outlook applied to overall production provides the revenue available to the industry. The reinvestment of a portion of the revenue as capital expenditures enables the industry to drill new wells. The capital expenditures, divided by the daily cost of drilling, provides the number of drill days available in a year. The number of new wells drilled in each year is equal to the number of drill days per year, divided by the number of days required to drill and complete an average well. The projected production performance of an average well is based on historical performance, specifically on how the initial production (IP) rates and decline rates change over time.
For this analysis, western Canada is disaggregated into groupings based on geography and stratigraphy. The number of producing wells and well performance, both historical and projected, are analysed for each grouping. The production projections for all groupings are then summed to determine total western Canadian production. Details on how western Canada is disaggregated into groupings are in Appendix A1.1. The methods used to determine well performance are discussed in Appendix A1.2. The results for each grouping, including IP rates and decline parameters, are in Appendix B and Appendix C [EXCEL 7599 KB].
Figure A1.1 Overall Method
A1.1 Groupings for Production Decline Analysis
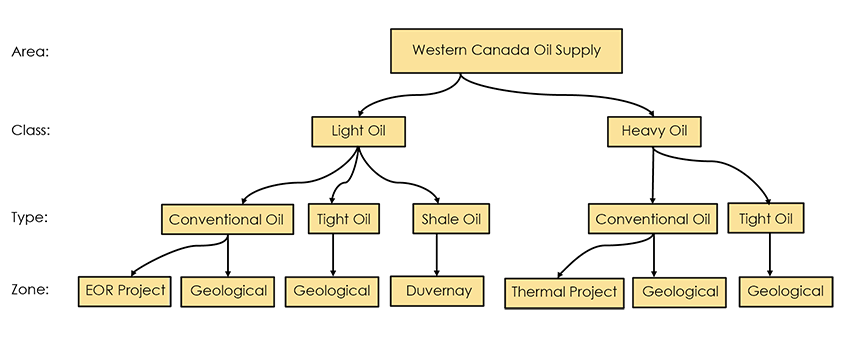
To assess oil deliverability for western Canada, oil production and wells are split into various categories as shown in Figure A1.2. Splitting out western Canada by area, class, type, and grouped geological formations resulted in 250 total groupings, which are listed in Appendix A3.2. Of the 250 groupings, approximately 150 have, or have had, producing wells and thus historical production. The remaining groupings are placeholders for potential future development.
Figure A1.2 Western Canada Oil Supply Categories for Oil Production Projection
A1.1.1 Oil Areas
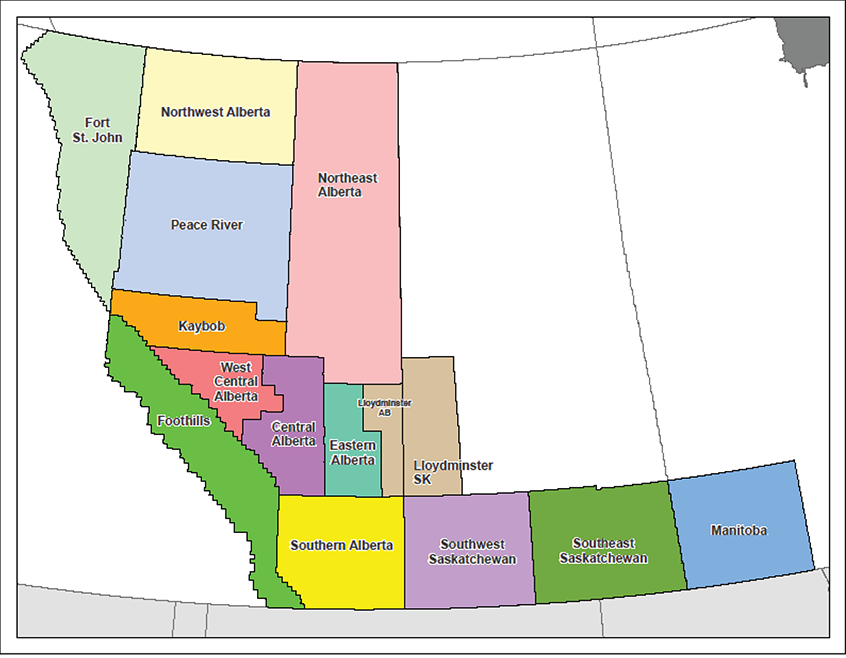
Oil wells and production are grouped geographically based on petroCUBEFootnote 11 areas for Alberta, B.C., Saskatchewan, and Manitoba, as shown in Figure A1.3. The Lloydminster area is further broken down by province. There are 10 areas in Alberta and three in Saskatchewan. Northeast BC is considered one area, as is Southwest Manitoba.
Figure A1.3 Western Canada Oil Areas Map
A1.1.2 Class Light or Heavy
Each provincial regulator has its own criteria for classifying crude oil as light, heavy, extra–heavy, or medium. For this report, consistent with NEB practice, oil production has been categorized into only two classes: light and heavy.
B.C. and Alberta oil production with a density of less than 900 kg/m³ (25.6 APIFootnote 12) is classified as light, and oil with a density of more than 900 kg/m³ is classified as heavy. If the density information is missing for a well, it is classified based on other wells in the same pool. Based on the well data, all oil produced in B.C. has, and will be, light oil.
The classification of Saskatchewan oil wells is based on their oil density and geographic area. Lloydminster wells have historically been classified by the Saskatchewan regulator as heavy when their oil production has a density greater than 945 kg/m³ (18.1 API). Light oil in the Kindersley area has a density ranging between 840 and 875 kg/m³ (36.8 and 30.1 API) while heavy oil in this area ranges between 949 and 996 kg/m³ (17.5 and 10.4 API). Swift Current area wells with oil production densities ranging between 885 and 997 kg/m³ (28.2 and 10.3 API), are classified as medium by the provincial regulator, but for this report they are classified as heavy for greater consistency with the categories of other provinces. Oil wells in the Estevan/Weyburn area that are classified as light by the provincial regulator were also classified as light in this report, and have oil densities ranging from 760 to 896 kg/m³ (54.5 and 26.3 API). Estevan/Weyburn wells classified as medium by the provincial regulator are classified in this report as heavy if the well is a conventional oil well and light if the well is a tight oil well, because crude oil developed like tight oil in Saskatchewan tends to be on the much lighter side of medium (see section A1.1.2 for information on well types). Historically, these wells have had oil densities ranging from 827 to 956 kg/m³ (39.4 to 16.4 API). Wells with missing classification or density information are classified as light or heavy based on the area.
All oil wells in Manitoba are classified as light. Oil densities in Manitoba have ranged between 838 and 903 kg/m³ (37.2 and 25.0 API).
A1.1.3 Type Conventional, Tight or Shale
Once an oil well is classified as light or heavy, it is further categorized as either conventional, tight, or shale.
An oil well is classified as tight if it is a horizontal well that produces from the following formations and was drilled after a certain date:
Bakken/Three Forks/Torquay: after 2004; MB, SK (Estevan) or AB; Bakken, Torquay and Exshaw Formations,
Beaverhill: after 2008 in AB; Beaverhill Lake Group or Swan Hills Formation (not the Slave Point Formation),
Belly River: after 2009 in AB; Belly River Group,
Cardium: after 2007 in AB; Cardium Formation,
Charlie Lake: after 2008 in AB; Charlie Lake, Halfway, and Boundary Formations,
Dunvegan: after 2009 in AB; Dunvegan Formation,
Lower Shaunavon: after 2005 in SK, Shaunavon Formation,
Montney/Doig: after 2008 in AB and after 2010 in BC; Montney, Doig, or Triassic Formations,
Pekisko: after 2008 in AB; Pekisko Formation,
Slave Point: after 2008 in AB; Slave Point Formation,
Spearfish: after 2008 in MB; Lower Amaranth Formation,
Viking: after 2007 in SK and AB; Viking Formation.
An oil well is considered shale oil if it is horizontal, drilled after 2007 in Alberta and is producing from the Duvernay Formation.
A1.1.4 Zone Formation Groups
There are thousands of stratigraphic horizons identified in the well data from the WCSB. This report aggregates these horizons into broader geologic zones, or groupings of formations. The geologic zones are:
Tertiary
Upper Cretaceous
Upper Colorado
Colorado
Upper Mannville
Middle Mannville
Lower Mannville
Jurassic
Upper Triassic
Lower Triassic
Permian
Mississippian
Upper Devonian
Middle Devonian
Lower Devonian
Siluro/Ordivician
Cambrian
PreCambrian
These geologic zones may be further aggregated into groupings of particular formations, based on criteria such as the area, similar well characteristics, or number of wells.
Within each grouping, oil wells were grouped by well year, with all wells drilled prior to 1999 forming a single group and separate yearly classifications for each year from 1999 and on. Thus, for each grouping, average well performance can by analysed over time to see how IP rates and declines change as the resource is developed and as technology evolves.
A1.1.5 Enhanced Oil Recovery Projects
There are at least ten thermal projects in Saskatchewan in Area 12, two CO2–EOR projects in Area 14 in Saskatchewan and one in Area 10 in northwest Alberta. Each of these projects are identified as separate groupings in the analysis. Since these methods of oil extraction are more ‘project–based’, wells that are identified as part of these projects are not included in the overall decline analysis. Instead, oil production projections for these projects are based on recent production trends as well as producer plans for continued development.
Each of the thermal projects produces heavy, conventional oil from the Mannville Group. The thermal projects are:
Senlac
Onion Lake
Celtic GP/Sparky
Rush Lake
Lashburn
Pikes Peak
Pikes Peak South
Plover Lake
Sandall
Bolney/Celtic
The CO2–EOR projects in Saskatchewan produce heavy, conventional oil from the Mississippian zone. The Alberta project produces light, conventional oil from the Mississippian and Devonian zones. The Saskatchewan and Alberta CO2–EOR projects are:
Weyburn (Area 14)
Midale (Area 14)
Zama (Area 10)
There are other existing and potential EOR projects in western Canada that may be analysed as individual groupings in future editions of this report.
A1.1.6 Oil Production from Gas Wells
Oil production from natural gas wells is minimal. In Alberta, less than two per cent of conventional and tight oil production comes from gas wells. Since all wells producing oil are included in the existing well analysis, projected oil production from gas wells is embedded in the group projections. Oil production from future gas wells is not directly projected. Analysis of condensate production is included in a separate analysis in the Canada’s Energy Future 2018 Supplement: Natural Gas Liquids Supply and Disposition report.
A1.2 Oil Well Performance Methods
For this report, historical production data was analysed to determine production declines which were then used to determine future performance. In some cases, historical data of newer tight and shale oil development is more limited and production decline trends are not as established. Information gathered during consultations with industry, when possible, and from publicly available data played a larger role in establishing expected well performance for these newer tight and shale oil groupings.
The analysis includes wells drilled since 2000, which creates a large dataset of historical well production trends. The methods applied to project oil production for existing wells differ from those used to project oil production for future wells.
Historical production data is analysed to determine production declines for each grouping (oil area/class/type/zone/well year) to develop two sets of parameters:
- Group decline parameters – describing production expectations for the entire oil grouping.
- Average well decline parameters – describing production expectations for the average oil well in the grouping for each year.
The group decline parameters and average well decline parameters resulting from this analysis are contained in Appendices A3.3, A4.1, and A4.2, respectively.
Oil wells are grouped by area, class, type, geological zone, and well year. For each of these groupings, a data set of oil production history is created and a data set of average well production history is also generated.
The data sets used to estimate group decline parameters are generated by the following: Oil production in each grouping is summed to estimate total group oil production (bbl/d) by calendar month.
Using this data set, plots of the total daily oil production rate versus total cumulative oil production are generated for each grouping.
The data sets used to determine average well decline parameters are generated by the following:
- The historical, monthly oil production for each well in the grouping is put in a database.
- For each well, the production months are normalized such that the month the well started producing becomes the first production month.
- The total oil production by normalized production month is then divided by the total number of wells in the grouping to determine normalized, monthly oil production for the average well.
- The normalized, monthly oil production is then divided by the average number of days in a month, or 30.4375, to determine the daily production rates for the average well in the grouping.
- Using this data set, plots of the daily oil production rate versus cumulative oil production for the average well are generated for each grouping.
After the average well’s historical production for each grouping and year is determined, each average well is evaluated in sequence, from 2000 through 2016.
- Production Decline Analysis for the Average Well:
For each well year, the daily rate versus cumulative production plot for the average well is evaluated first to establish: -
- Initial Production Rate
- First Decline Rate
- Second Decline Rate
- Months to Second Decline Rate – usually around seven months
- Third Decline Rate
- Months to Third Decline Rate – usually around 25 months
- Fourth Decline Rate
- Months to Fourth Decline Rate – usually around 45 months
- Fifth Decline Rate
- Months to Fifth Decline Rate – usually around 90 months.
Figure A1.4 shows an example of the plots used to evaluate average well performance, and the different decline rates that are applied to describe the production.
Figure A1.4 Example of an Average Well Production Decline Analysis Plot
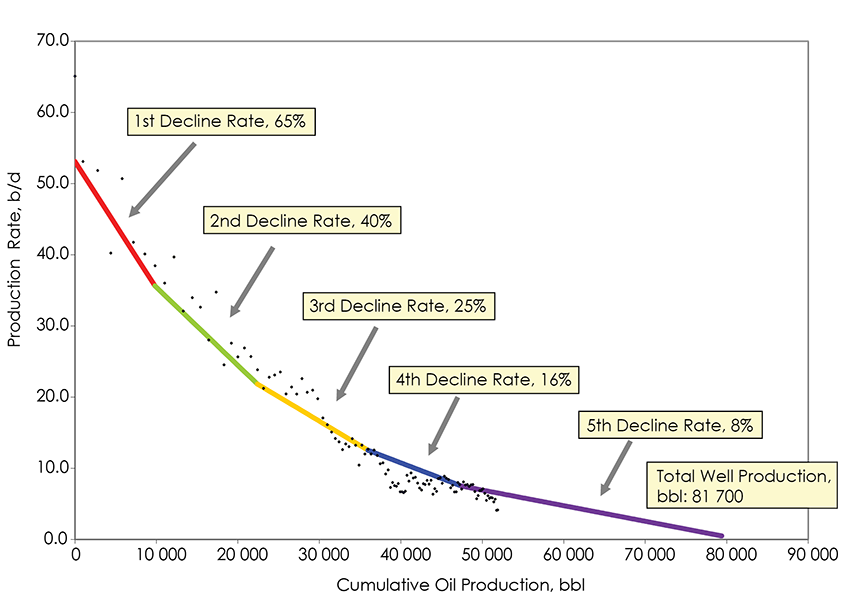
“Older” average wells usually have sufficient data to establish all of the above parameters. However, “younger” average wells have historical production data of shorter duration. Therefore, the projected long–term performance of a “younger” average well is assumed to be similar to the historical long–term performance of an “older“ average well. In Figure A1.4, the available data is sufficient to determine parameters defining the first, second, third, and fourth decline periods for the well, but the parameters defining the fifth decline period must be assumed based on the analysis of earlier well years.
The estimated decline parameters for average wells are available in Appendix A4.
- Production Decline Analysis for the Grouped Data:
Performance parameters for an average well are used to calculate the expected group performance. If the data calculated from average well performance data does not provide a good match with the actual historical production data for the group, then the average well parameters may be revised until a good match is obtained between calculated group production data (from average well data) and actual group production data. An example is shown in Figure A1.5.
Figure A1.5 Example of a Group Production Decline Analysis Plot
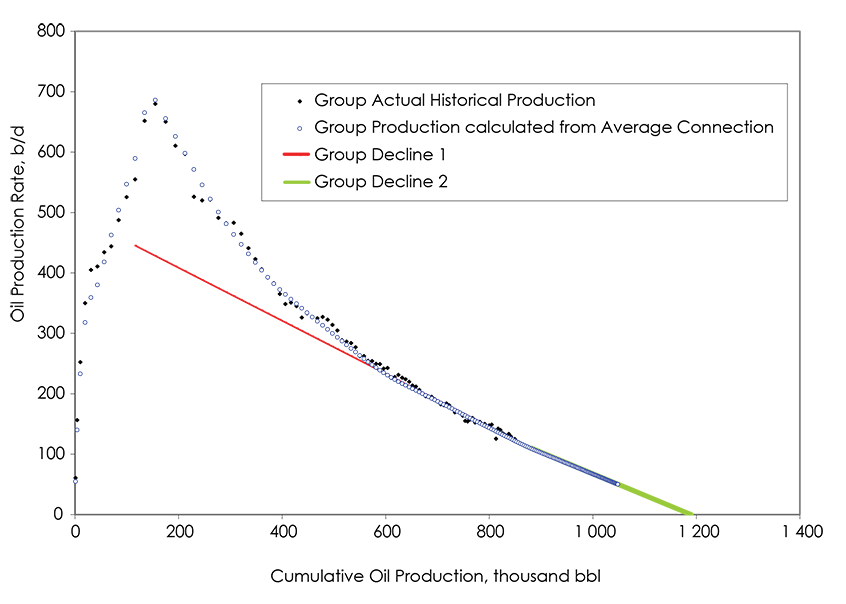
The following group performance parameters are determined from the plot of calculated and actual production:
- Production Rate as of December 2014
- First Decline Rate
- Second Decline Rate (if applicable)
- Months to Second Decline Rate (if applicable)
- Third Decline Rate (if applicable)
- Months to Third Decline Rate (if applicable)
- Fourth Decline Rate (if applicable)
- Months to Fourth Decline Rate (if applicable)
- Fifth Decline Rate (if applicable)
- Months to Fifth Decline Rate (if applicable)
A1.2.1 Methods for Existing Wells
In this report, “existing wells” are those brought on production prior to 1 January 2017. Group decline parameters are used to project oil production for existing wells.
In groupings of older wells (2001, 2002, etc.), actual group production from recent years is usually stabilized or is near the terminal decline rate established by the pre–1999 aggregate grouping. In these cases, a single decline rate sufficiently describes the entire remaining productive life of the grouping and the expected performance of the calculated average well has little influence over determination of the group parameters.
In groupings of wells drilled more recently (2014, 2015, etc.), actual group production history data is unlikely to provide a good basis upon which to project future oil production. In these cases, the expected performance of the average well is more speculative with respect to the applicable current and future decline rates.
Group performance parameters are available in Appendix A3.3.
A1.2.2 Methods for Future Wells
In this report, “future wells” are those brought on production from 1 January 2017 onwards. For future wells, projected oil production is based on the number of future wells to be drilled and the expected average performance characteristics of those wells. Historical trends in average well performance, obtained from production decline analysis of existing oil wells, are used to estimate average well performance for future wells.
A1.2.2.1 Performance of Future Wells
The performance of future wells is obtained for each oil grouping by extrapolating the production performance trends for average wells in past years, namely initial productivity of the average well and its associated decline rates.
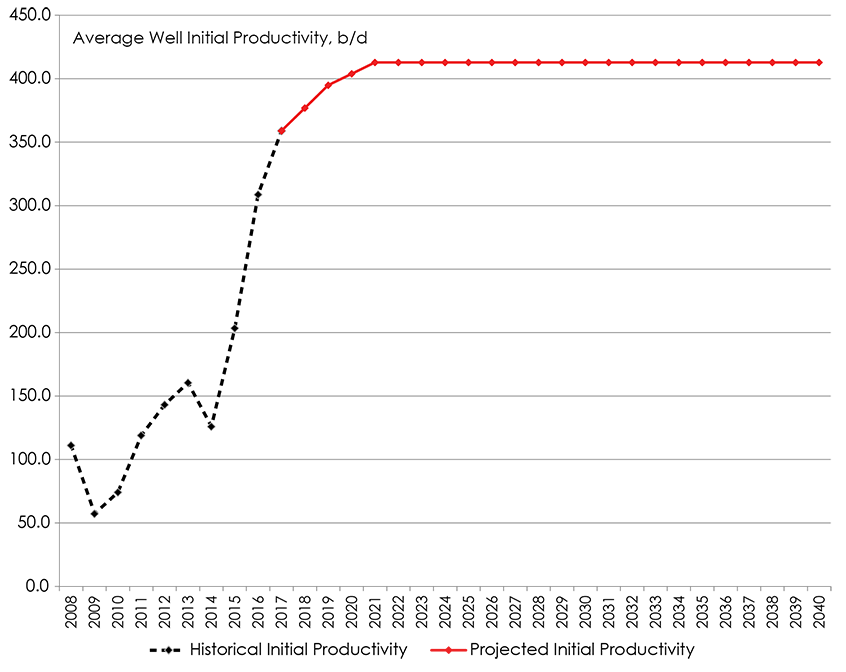
In some groupings, the initial productivity of the average oil well decreases over time. Recently however, some conventional and tight groupings have average oil wells with initial productivity which has been increasing due to technology, as displayed in Figure A1.6. This graph shows the IP rates for oil wells in the Peace River Light, Tight, Colorado, Mannville, Jurassic, Triassic grouping. The IP rate for future oil wells is estimated by extrapolating the trend in each oil grouping, taking into account technological trends and possible recovery constraints. Historical and projected initial productivities for average wells for future oil groupings are in Appendix A4.1 and A4.2.
Figure A1.6 – Example of Initial Productivity of Average Well by Year – Peace River Light Tight Colorado–Mannville–Jurassic–Triassic Grouping
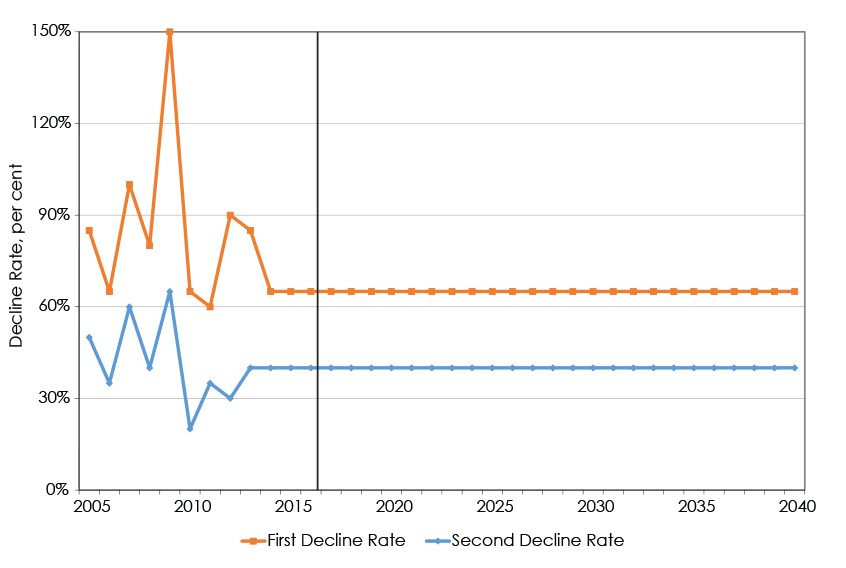
The key decline parameters for near–term production projections are the first decline rate, second decline rate, and the months elapsed to reach the second decline rate. Figure A1.7 shows the historical and projected values of these parameters for the average Eastern Alberta heavy, conventional, upper Mannville well. As shown in Figure A1.7, trends in past well years are used to establish parameters for future years.
Figure A1.7 Example of Key Decline Parameters for Average Wells over time Eastern Alberta Heavy Conventional Upper Mannville Grouping
A1.2.2.2 Number of Future Wells
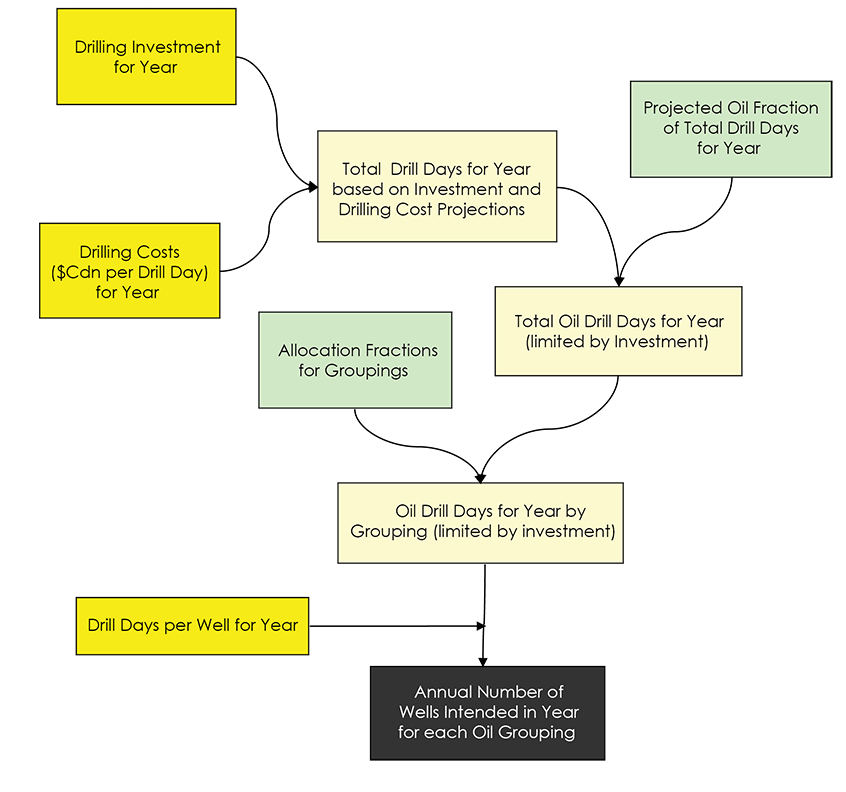
Projecting the number of future wells requires an estimate of the annual number of oil wells to be drilled and placed into production for each grouping.
Figure A1.8 is the flowchart describing the methodology for projecting the number of oil wells for each year over the projection period. The key inputs are annual drilling investment, costs per drill day, and days to drill a well. Adjustments to these three key inputs (shown as yellow boxes in Figure A1.8) produce different projections of drilling activity in the WCSB. Other required inputs are shown in the green boxes in Figure A1.8. The values for these other inputs are estimated from an analysis of historical data.
For the projection, the Board allocates oil drill days between each of the oil groupings. The allocation fractions are determined from historical trends and the Board’s projection of development potential for each of the groupings. Recently, the allocation fractions reflect the historical trends of an increasing focus on deeper formations and increasing development of tight oil plays and the Duvernay Shale. Tables of the historical data (drill days and allocation fractions) and the projected allocation fractions are available in Appendix B.
The number of oil wells drilled in each year for a grouping is calculated by dividing the drill days targeting that grouping, by the average number of drill days per well.
Figure A1.8 Flowchart of Drilling Projection Method
Appendix A2 – DECLINE PARAMETERS – RESULTS
A2.1 Production from Existing Oil Wells
The decline parameters describing the expected future production of each grouping are in Appendix A3.3.
The parameters describing future production for all of these groupings are the production rate as of December 2017 and as many as five future decline rates that apply to specified timeframes in the future. For the older groupings of wells, where production appears to have stabilized at a final decline rate, only one future decline rate is needed to describe future group production. For newer wells the decline rate that applies over future months changes as the group performance progresses towards the final stable decline period. For these newer well groupings, three to four different decline rates have been determined to describe future performance.
The future production projected for these groupings represents the production that would occur from the WCSB if no further oil wells were added after 2017.
A2.2 Production from Future Oil Wells
While production projections for existing oil wells are more predictable, production projections for future oil wells are much less so. The key uncertainty is the level of oil drilling that will occur. Various cases are analysed to address the uncertainty inherent in the oil drilling projections.
A2.2.1 Performance Parameters for Future Average Oil Wells
The overall trend for initial productivity of the average oil well in the WCSB is shown in Figure A2.1. Between 2002 and 2007, initial productivity decreased as conventional resources matured. However, the trend reversed upward from 2008 to 2016 given the focus on deeper resources. The average IP dropped in 2017 as a result of increased number of shallower wells–which have lower productivity rates–drilled in SK. This increases in 2018, as fewer wells are drilled and the focus shifts to the deeper resources. This increase stays level over the projection and the effect of the focus on deeper wells balances out the effect of a maturing resource with fewer sweet spots.
Figure A2.1 Average Initial Productivity of all WCSB Oil Wells by Well Year
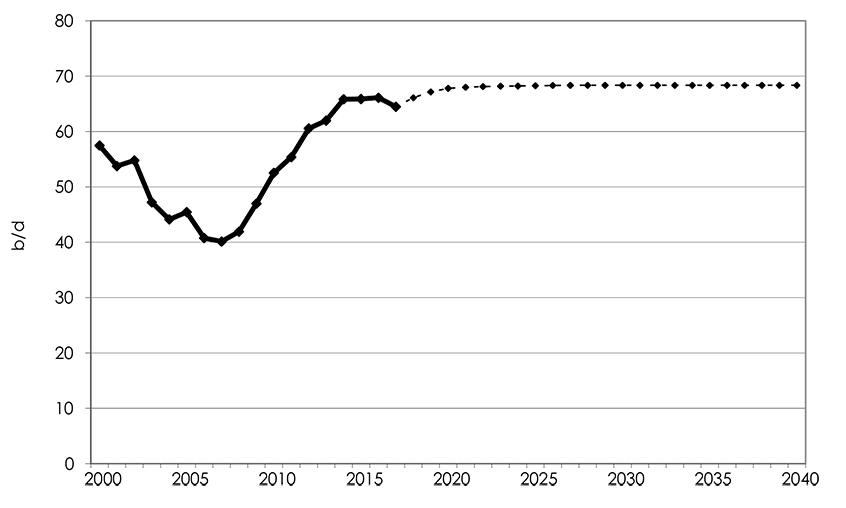
Table A2.1 shows the historical average IP rates for the average oil wells for each area.
Table A2.1 Average Initial Productivity of Oil Wells by Year by Area – bbl/d
Projected average well performance is the same in all six cases assessed for this report. Overall, production varies between the cases as a result of differing levels of oil drilling activity, as discussed further in the next section.
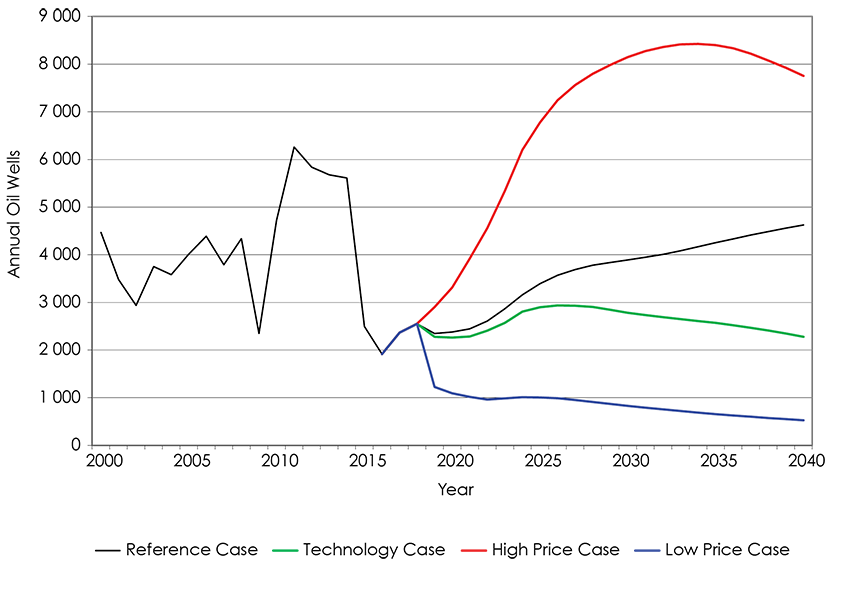
A2.2.2 Number of Future Oil Wells
Drilling activity in a case depends on the assumed oil prices in that case. Figure A2.2 indicates the projected number of oil wells for all groupings in each case.
Appendix B contains detailed tabulations of projected annual oil drill days and oil wells for each grouping, by case.
Figure A2.2 Oil Wells by Case
A2.3 Thermal and CO2 Oil Projects
As indicated in Appendix A1.1.5, oil production projections for the thermal and CO2 enhanced oil recovery (EOR) projects are based on extrapolation of prior trends and currently announced plans of producers. Production from EOR projects in SK grows substantially over the projection.
Appendix A3 Indexes and Decline Parameters for Groupings of Existing Oil Wells
Table A3.1 – Formation Index
| Formation | Abbreviation | Group Number |
|---|---|---|
| Tertiary | Tert | 02 |
| Upper Cretaceous | UprCret | 03 |
| Upper Colorado | UprCol | 04 |
| Colorado | Colr | 05 |
| Upper Mannville | UprMnvl | 06 |
| Middle Mannville | MdlMnvl | 07 |
| Lower Mannville | LwrMnvl | 08 |
| Mannville | Mnvl | 06;07;08 |
| Jurassic | Jur | 09 |
| Upper Triassic | UprTri | 10 |
| Lower Triassic | LwrTri | 11 |
| Triassic | Tri | 10;11 |
| Permian | Perm | 12 |
| Mississippian | Miss | 13 |
| Upper Devonian | UprDvn | 14 |
| Middle Devonian | MdlDvn | 15 |
| Lower Devonian | LwrDvn | 16 |
| Siluro/Ordivician | Sil | 17 |
| Cambrian | Camb | 18 |
| PreCambrian | PreCamb | 19 |
Table A3.2 Grouping Index
| Area Name | Area Number | Resource Class | Resource Type | Resource Group |
|---|---|---|---|---|
| Southern Alberta | 01 | Heavy | Conventional | 03;04;05;06 |
| Southern Alberta | 01 | Heavy | Conventional | 07 |
| Southern Alberta | 01 | Heavy | Conventional | 08 |
| Southern Alberta | 01 | Heavy | Conventional | 09;10 |
| Southern Alberta | 01 | Heavy | Conventional | 13;14;15 |
| Southern Alberta | 01 | Heavy | Tight | 03;04;05;06 |
| Southern Alberta | 01 | Heavy | Tight | 07;08 |
| Southern Alberta | 01 | Heavy | Tight | 09;10 |
| Southern Alberta | 01 | Heavy | Tight | 13;14;15 |
| Southern Alberta | 01 | Light | Conventional | 03;04;05;06 |
| Southern Alberta | 01 | Light | Conventional | 07 |
| Southern Alberta | 01 | Light | Conventional | 08 |
| Southern Alberta | 01 | Light | Conventional | 09;10 |
| Southern Alberta | 01 | Light | Conventional | 13;14;15 |
| Southern Alberta | 01 | Light | Tight | 03;04;05;06 |
| Southern Alberta | 01 | Light | Tight | 07;08;09;10 |
| Southern Alberta | 01 | Light | Tight | 13;14;15 |
| Lloydminster Alberta | 02 | Heavy | Conventional | 03;04;05 |
| Lloydminster Alberta | 02 | Heavy | Conventional | 06 |
| Lloydminster Alberta | 02 | Heavy | Conventional | 07;08 |
| Lloydminster Alberta | 02 | Heavy | Conventional | 13 |
| Lloydminster Alberta | 02 | Heavy | Conventional | 14 |
| Lloydminster Alberta | 02 | Heavy | Tight | 03;04;05;06;07;08 |
| Lloydminster Alberta | 02 | Heavy | Tight | 13;14 |
| Lloydminster Alberta | 02 | Light | Conventional | 03;04;05 |
| Lloydminster Alberta | 02 | Light | Conventional | 06 |
| Lloydminster Alberta | 02 | Light | Conventional | 07;08 |
| Lloydminster Alberta | 02 | Light | Conventional | 13;14 |
| Lloydminster Alberta | 02 | Light | Tight | 03;04;05;06 |
| Lloydminster Alberta | 02 | Light | Tight | 07;08 |
| Lloydminster Alberta | 02 | Light | Tight | 13;14 |
| Eastern Alberta | 03 | Heavy | Conventional | 03;04;05 |
| Eastern Alberta | 03 | Heavy | Conventional | 06 |
| Eastern Alberta | 03 | Heavy | Conventional | 07;08;09;10 |
| Eastern Alberta | 03 | Heavy | Conventional | 13;14;15 |
| Eastern Alberta | 03 | Heavy | Tight | 03;04;05;06 |
| Eastern Alberta | 03 | Heavy | Tight | 07;08;09;10 |
| Eastern Alberta | 03 | Heavy | Tight | 13;14;15 |
| Eastern Alberta | 03 | Light | Conventional | 03;04;05 |
| Eastern Alberta | 03 | Light | Conventional | 06 |
| Eastern Alberta | 03 | Light | Conventional | 07;08;09;10 |
| Eastern Alberta | 03 | Light | Conventional | 13;14;15 |
| Eastern Alberta | 03 | Light | Tight | 03;04;05;06 |
| Eastern Alberta | 03 | Light | Tight | 07;08;09;10 |
| Eastern Alberta | 03 | Light | Tight | 13;14;15 |
| Central Alberta | 04 | Heavy | Conventional | 02;03 |
| Central Alberta | 04 | Heavy | Conventional | 04;05;06 |
| Central Alberta | 04 | Heavy | Conventional | 07;08 |
| Central Alberta | 04 | Heavy | Conventional | 09;10 |
| Central Alberta | 04 | Heavy | Conventional | 13 |
| Central Alberta | 04 | Heavy | Conventional | 14;15 |
| Central Alberta | 04 | Heavy | Tight | 02;03;04;05;06;07;08 |
| Central Alberta | 04 | Heavy | Tight | 09;10 |
| Central Alberta | 04 | Heavy | Tight | 13;14;15 |
| Central Alberta | 04 | Light | Conventional | 02;03 |
| Central Alberta | 04 | Light | Conventional | 04;05;06 |
| Central Alberta | 04 | Light | Conventional | 07;08 |
| Central Alberta | 04 | Light | Conventional | 09;10 |
| Central Alberta | 04 | Light | Conventional | 13 |
| Central Alberta | 04 | Light | Conventional | 14;15 |
| Central Alberta | 04 | Light | Tight | 02;03;04;05;06;07;08 |
| Central Alberta | 04 | Light | Tight | 09;10 |
| Central Alberta | 04 | Light | Tight | 13;14;15 |
| Central Alberta | 04 | Light | Shale | Duvernay |
| West Central Alberta | 05 | Heavy | Conventional | 03 |
| West Central Alberta | 05 | Heavy | Conventional | 04;05;06;07;08 |
| West Central Alberta | 05 | Heavy | Conventional | 09 |
| West Central Alberta | 05 | Heavy | Conventional | 12;13 |
| West Central Alberta | 05 | Heavy | Conventional | 14;15 |
| West Central Alberta | 05 | Heavy | Tight | 03;04;05;06;07;08;09 |
| West Central Alberta | 05 | Heavy | Tight | 12;13;14;15 |
| West Central Alberta | 05 | Light | Conventional | 03 |
| West Central Alberta | 05 | Light | Conventional | 04;05;06;07;08 |
| West Central Alberta | 05 | Light | Conventional | 09 |
| West Central Alberta | 05 | Light | Conventional | 12;13 |
| West Central Alberta | 05 | Light | Conventional | 14;15 |
| West Central Alberta | 05 | Light | Tight | 03 |
| West Central Alberta | 05 | Light | Tight | 04;05 |
| West Central Alberta | 05 | Light | Tight | 06;07;08;09 |
| West Central Alberta | 05 | Light | Tight | 12;13;14;15 |
| West Central Alberta | 05 | Light | Shale | Duvernay |
| Foothills | 06 | Heavy | Conventional | 03;04;05;06;07;08;09 |
| Foothills | 06 | Heavy | Conventional | 13;14 |
| Foothills | 06 | Heavy | Tight | 03;04;05;06;07;08;09 |
| Foothills | 06 | Heavy | Tight | 13;14 |
| Foothills | 06 | Light | Conventional | 03;04;05;06;07;08;09 |
| Foothills | 06 | Light | Conventional | 13;14 |
| Foothills | 06 | Light | Tight | 03;04;05;06;07;08;09 |
| Foothills | 06 | Light | Tight | 13;14 |
| Kaybob | 07 | Heavy | Conventional | 03;04;05;06;07;08 |
| Kaybob | 07 | Heavy | Conventional | 09;10;11;12 |
| Kaybob | 07 | Heavy | Conventional | 13;14;15;16 |
| Kaybob | 07 | Heavy | Tight | 03;04;05;06;07;08 |
| Kaybob | 07 | Heavy | Tight | 09;10;11;12 |
| Kaybob | 07 | Heavy | Tight | 13;14;15;16 |
| Kaybob | 07 | Light | Conventional | 03;04;05;06;07;08 |
| Kaybob | 07 | Light | Conventional | 09;10;11;12 |
| Kaybob | 07 | Light | Conventional | 13;14;15;16 |
| Kaybob | 07 | Light | Tight | 03;04;05;06;07;08 |
| Kaybob | 07 | Light | Tight | 09;10;11;12 |
| Kaybob | 07 | Light | Tight | 13;14;15;16 |
| Kaybob | 07 | Light | Shale | Duvernay |
| Peace River | 08 | Heavy | Conventional | 03;04;05 |
| Peace River | 08 | Heavy | Conventional | 06;07 |
| Peace River | 08 | Heavy | Conventional | 08 |
| Peace River | 08 | Heavy | Conventional | 09;10;11 |
| Peace River | 08 | Heavy | Conventional | 12;13 |
| Peace River | 08 | Heavy | Conventional | 14 |
| Peace River | 08 | Heavy | Conventional | 15 |
| Peace River | 08 | Heavy | Conventional | 16 |
| Peace River | 08 | Heavy | Tight | 03;04;05;06;07;08 |
| Peace River | 08 | Heavy | Tight | 09;10;11 |
| Peace River | 08 | Heavy | Tight | 12;13;14;15;16 |
| Peace River | 08 | Light | Conventional | 03;04 |
| Peace River | 08 | Light | Conventional | 05 |
| Peace River | 08 | Light | Conventional | 06;07 |
| Peace River | 08 | Light | Conventional | 08 |
| Peace River | 08 | Light | Conventional | 09;10;11 |
| Peace River | 08 | Light | Conventional | 12;13 |
| Peace River | 08 | Light | Conventional | 14 |
| Peace River | 08 | Light | Conventional | 15 |
| Peace River | 08 | Light | Conventional | 16 |
| Peace River | 08 | Light | Tight | 03;04 |
| Peace River | 08 | Light | Tight | 05;06;07;08;09;10;11 |
| Peace River | 08 | Light | Tight | 12;13;14;15;16 |
| Northeast Alberta | 09 | Heavy | Conventional | 01;02;03 |
| Northeast Alberta | 09 | Heavy | Conventional | 04;05;06;07;08 |
| Northeast Alberta | 09 | Heavy | Conventional | 14 |
| Northeast Alberta | 09 | Heavy | Tight | 01;02;03 |
| Northeast Alberta | 09 | Heavy | Tight | 04;05;06;07;08 |
| Northeast Alberta | 09 | Heavy | Tight | 14 |
| Northeast Alberta | 09 | Light | Conventional | 01;02;03;04;05;06;07 |
| Northeast Alberta | 09 | Light | Conventional | 08 |
| Northeast Alberta | 09 | Light | Conventional | 14 |
| Northeast Alberta | 09 | Light | Tight | 01;02;03 |
| Northeast Alberta | 09 | Light | Tight | 04;05;06;07;08;14 |
| Northwest Alberta | 10 | Heavy | Conventional | 08;13;14;15 |
| Northwest Alberta | 10 | Heavy | Tight | 08;13;14;15 |
| Northwest Alberta | 10 | Light | Conventional | 08;13;14;15 |
| Northwest Alberta | 10 | Light | Tight | 08;13;14;15 |
| Fort St. John | 11 | Heavy | Conventional | 04;05;06;07;08 |
| Fort St. John | 11 | Heavy | Conventional | 10;11 |
| Fort St. John | 11 | Heavy | Conventional | 12;13;14 |
| Fort St. John | 11 | Heavy | Tight | 04;05;06;07;08 |
| Fort St. John | 11 | Heavy | Tight | 10;11;12;13;14 |
| Fort St. John | 11 | Light | Conventional | 04;05;06;07;08 |
| Fort St. John | 11 | Light | Conventional | 10;11 |
| Fort St. John | 11 | Light | Conventional | 12;13;14 |
| Fort St. John | 11 | Light | Tight | 04;05;06;07;08 |
| Fort St. John | 11 | Light | Tight | 10;11;12;13;14 |
| Lloydminster Saskatchewan | 12 | Heavy | Conventional | 03;04;05 |
| Lloydminster Saskatchewan | 12 | Heavy | Conventional | 06 |
| Lloydminster Saskatchewan | 12 | Heavy | Conventional | Celtic Sparky |
| Lloydminster Saskatchewan | 12 | Heavy | Conventional | Sparky |
| Lloydminster Saskatchewan | 12 | Heavy | Conventional | Lashburn |
| Lloydminster Saskatchewan | 12 | Heavy | Conventional | Pikes Peak |
| Lloydminster Saskatchewan | 12 | Heavy | Conventional | Plover Lake |
| Lloydminster Saskatchewan | 12 | Heavy | Conventional | Sandall Colony |
| Lloydminster Saskatchewan | 12 | Heavy | Conventional | Colony |
| Lloydminster Saskatchewan | 12 | Heavy | Conventional | Bolney |
| Lloydminster Saskatchewan | 12 | Heavy | Conventional | 07;08 |
| Lloydminster Saskatchewan | 12 | Heavy | Conventional | Seniac |
| Lloydminster Saskatchewan | 12 | Heavy | Conventional | Onion |
| Lloydminster Saskatchewan | 12 | Heavy | Conventional | Celtic GP |
| Lloydminster Saskatchewan | 12 | Heavy | Conventional | 13 |
| Lloydminster Saskatchewan | 12 | Heavy | Conventional | 14;15 |
| Lloydminster Saskatchewan | 12 | Heavy | Tight | 03;04;05;06;07;08 |
| Lloydminster Saskatchewan | 12 | Heavy | Tight | 13;14;15 |
| Lloydminster Saskatchewan | 12 | Light | Conventional | 03;04;05;06;07;08 |
| Lloydminster Saskatchewan | 12 | Light | Conventional | 13;14;15 |
| Lloydminster Saskatchewan | 12 | Light | Tight | 03;04;05;06;07;08 |
| Lloydminster Saskatchewan | 12 | Light | Tight | 13;14;15 |
| Southwest Saskatchewan | 13 | Heavy | Conventional | 03;04;05;06;07;08 |
| Southwest Saskatchewan | 13 | Heavy | Conventional | 09;13;14 |
| Southwest Saskatchewan | 13 | Heavy | Tight | 03;04;05;06;07;08 |
| Southwest Saskatchewan | 13 | Heavy | Tight | 09;13;14 |
| Southwest Saskatchewan | 13 | Light | Conventional | 03;04;05;06;07;08;09;13 |
| Southwest Saskatchewan | 13 | Light | Tight | 03;04;05;06;07;08;09;13 |
| Southeast Saskatchewan | 14 | Heavy | Conventional | 06;07;08 |
| Southeast Saskatchewan | 14 | Heavy | Conventional | 09;10;11 |
| Southeast Saskatchewan | 14 | Heavy | Conventional | 13 |
| Southeast Saskatchewan | 14 | Heavy | Conventional | 14;15;16;17;18;19 |
| Southeast Saskatchewan | 14 | Heavy | Tight | 06;07;08;09;10;11 |
| Southeast Saskatchewan | 14 | Heavy | Tight | 13 |
| Southeast Saskatchewan | 14 | Heavy | Tight | 14;15 |
| Southeast Saskatchewan | 14 | Heavy | Tight | 17;18;19 |
| Southeast Saskatchewan | 14 | Light | Conventional | 06;07;08;09;10;11 |
| Southeast Saskatchewan | 14 | Light | Conventional | 13 |
| Southeast Saskatchewan | 14 | Light | Conventional | 14;15 |
| Southeast Saskatchewan | 14 | Light | Conventional | 17;18;19 |
| Southeast Saskatchewan | 14 | Light | Tight | 06;07;08;09;10;11 |
| Southeast Saskatchewan | 14 | Light | Tight | 13 |
| Southeast Saskatchewan | 14 | Light | Tight | 14;15 |
| Southeast Saskatchewan | 14 | Light | Tight | 17;18;19 |
| Manitoba | 15 | Heavy | Conventional | 09;10;11;13;14 |
| Manitoba | 15 | Heavy | Tight | 09;10;11 |
| Manitoba | 15 | Heavy | Tight | 13;14 |
| Manitoba | 15 | Light | Conventional | 09;10;11;13;14 |
| Manitoba | 15 | Light | Tight | 09;10;11;13;14 |
Appendix B and Appendix C, as well as Appendix A3 and Appendix A4 [EXCEL 7599 KB], are available on the NEB website in an Excel file.
- Date modified: