Market Snapshot: Canadian natural gas exports to U.S. Midwest fall by 20% in the first half of 2020
Connect/Contact Us
Please send comments, questions, or suggestions for Market Snapshot topics to snapshots@cer-rec.gc.ca
Release date: 2020-10-28
Despite steady production, total Canadian natural gas exports to the United States (U.S.) declined by approximately 10% in the first seven months of 2020 compared to the same period last year. Reduced exports to the U.S. Midwest account for most of this decline. The U.S. Midwest is Canada’s largest natural gas export market, and exports to the region decreased by 20% over the first half of 2020 compared to same period last year. All three major pipelines that export to the U.S. Midwest – Foothills Saskatchewan pipeline, Alliance pipeline and the TransCanada Mainline pipeline – have seen flow reductions in the first half of the year.Footnote 1
Figure 1. Natural Gas Exports to the U.S. Midwest Market
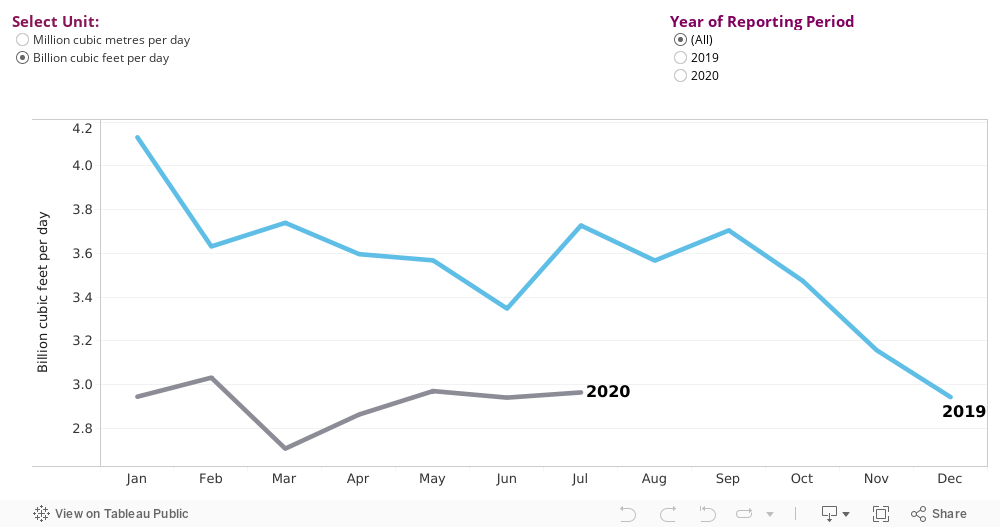
Source and Description
Source: Gas- Monthly Summary by Port, Commodities Statistics, CER
Description: This figure shows a line chart of Canadian natural gas exports to the U.S. Midwest market. It illustrates monthly export volumes from January 2019 to July 2020.
Decreased exports to the Midwest during the first quarter of 2020 was largely because of increased of natural gas processing capacity in the U.S. Bakken.Footnote 2 More Bakken gas supplying the Midwest markets crowded out Canadian gas imports on the Northern Border.Footnote 3 Bakken gas production directly impacts how much Canadian gas is supplied to the U.S. Midwest as both regions compete for capacity on the Northern Border pipeline (which interconnects with the Canadian Foothills Saskatchewan pipeline). By the end of the first quarter of 2020, exports on the Foothills Saskatchewan pipeline were down 43% compared to the first quarter in the previous year, partially reflecting Canadian gas exports being displaced by Bakken gas.
Figure 2. Foothills Saskatchewan Pipeline Exports to the U.S. at the Monchy Export Point
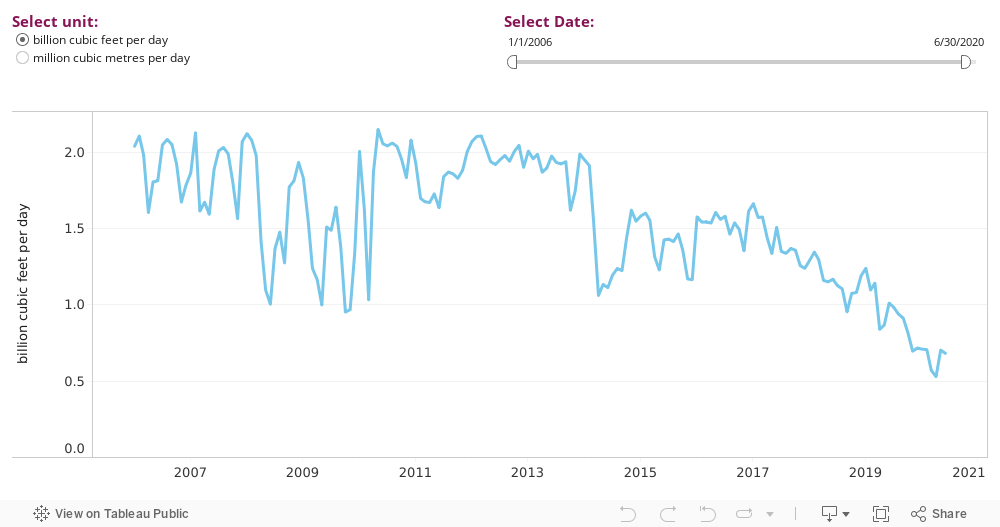
Source and Description
Source: Pipeline Traffic Data, Commodities Tracking System, CER
Description: This figure shows a line chart of Canadian natural gas exports from the Foothills Saskatchewan pipeline at the Monchy export port. It illustrates monthly exports from January 2006 to June 2020.
Bakken associated gas production began to decrease in April as a result of COVID-19 related oil price decline; which opened up some capacity for Canadian gas on the Northern Border pipeline. However, Canadian producers did not direct more gas onto the Northern Border pipeline and export volumes on the Foothills Saskatchewan pipeline decreased to its lowest level in over a decade in April 2020.Footnote 4 During this time, low Alberta natural gas storage levels, and very narrow price differentials between Canadian and U.S. markets, led domestic gas producers and shippers to direct more gas into storage rather than export to the U.S.Footnote 5
The supply-demand balance in U.S. natural gas markets may tightenFootnote 6 during the upcoming winter season, mostly due to lower associated gas production driven by the weaker oil price environment. A continued reduction in associated gas supply in the U.S. could lead to an increased demand for Canadian gas exports to the U.S. Midwest as well as higher AB-NIT prices in the coming winter months.
- Date modified: