Market Snapshot: A closer look at the international context for crude oil and natural gas markets in Canada’s Energy Future 2020
Connect/Contact Us
Please send comments, questions, or suggestions for Market Snapshot topics to snapshots@cer-rec.gc.ca
Release date: 2021-01-27
Following the annual release of our Canada’s Energy Future 2020: Energy Supply and Demand Projections to 2050 (EF2020), the CER is publishing a series of Market Snapshots that look in greater depth at some of the key outcomes and topics of interest to Canadians.
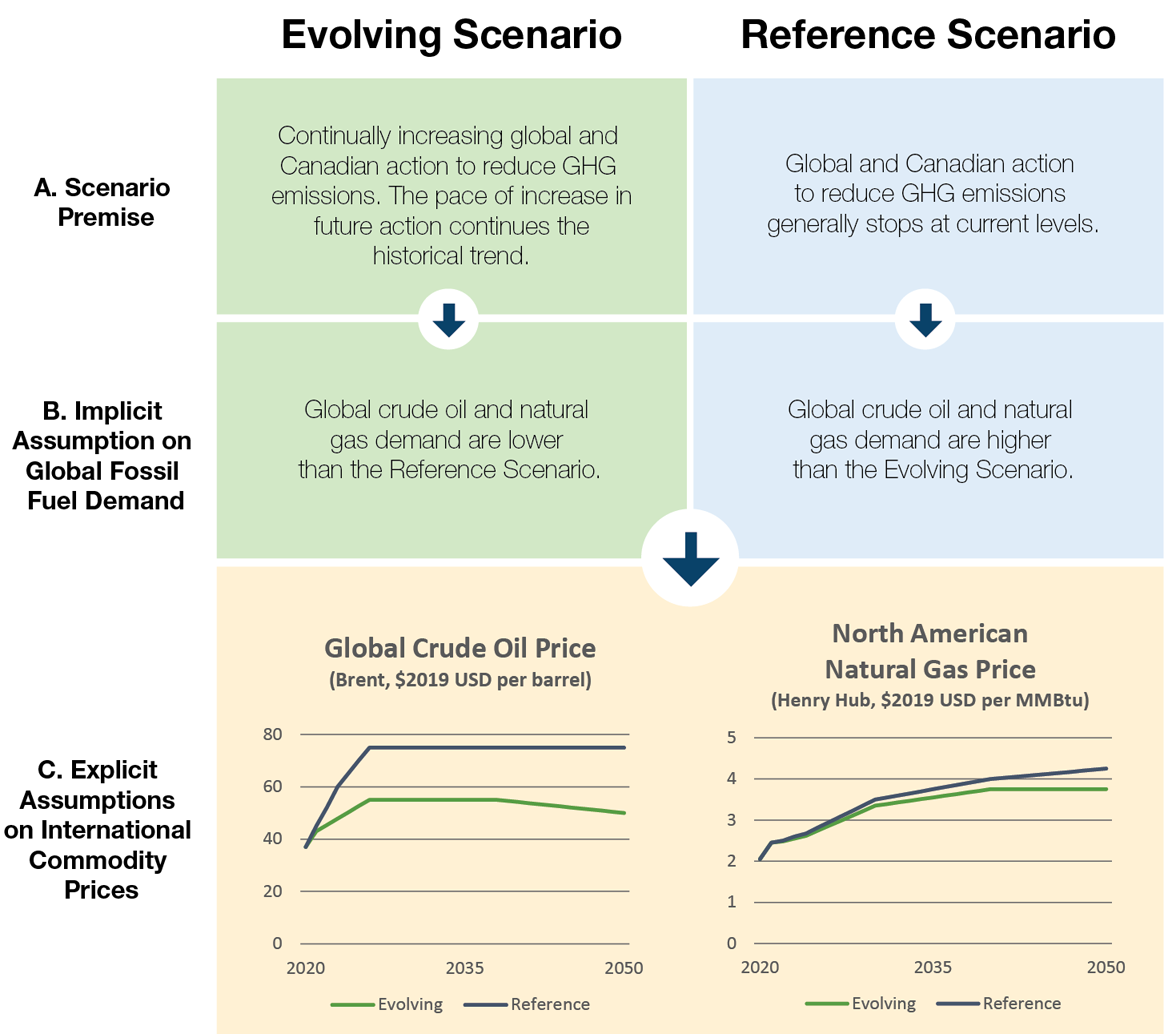
A key factor in energy supply and demand outcomes of the EF2020 Scenarios, Reference and Evolving, are our assumptions about the global price for crude oil and natural gas. The Reference and Evolving Scenarios have different premises regarding both Canadian and international climate action. Our analysis assumes that greater climate action globally translates into lower demand for fossil fuels in the Evolving Scenario relative to the Reference Scenario. This premise results in clear assumptions about crude oil and natural gas prices, which feed directly into our scenario modeling. Figure 1 illustrates how the international crude oil and natural gas market context relates to the EF2020 scenarios.Footnote 1
Figure 1. Global Crude Oil and Natural Gas Assumptions in EF2020
Source and Description
Source: CER
Description: This figure describes how the premises of our Evolving and Reference scenarios are represented explicitly in our modelling by crude oil and natural gas prices. The figure shows text boxes above two line charts that shows crude oil and natural gas prices over time for both scenarios, all in $2019 USD. In the Evolving Scenario, continually increasing global and Canadian action to reduce GHG emissions results in lower global crude oil and natural gas demand compared to the Reference Scenario. In the Reference Scenario, global and Canadian action to reduce GHG emissions generally stops at current levels, resulting in higher crude oil and natural gas demand compared to the Evolving Scenario. The first line chart shows that the Reference Scenario global crude oil price increases from about $40 per barrel in 2020 to $75 per barrel by 2030, and remains flat to 2050 while the Evolving Scenario price increase to about $55 per barrel by 2030, remains flat until about 2035, and then decreases to $50 per barrel by 2050. The second line chart shows that the Reference Scenario global natural gas price increases from about $2 per million British thermal units (MMBtu) in 2020 to $4.2MMBtu per barrel by 2050, while the Evolving Scenario price increases to about $3.75 per MMBtu by 2050.
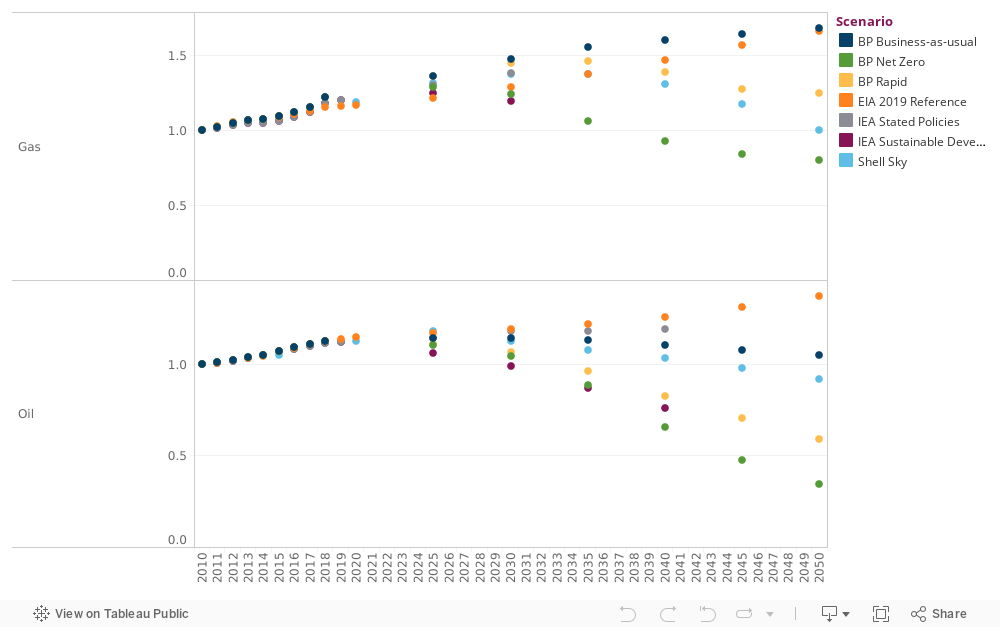
While our Energy Futures series modeling is limited to Canada, various organizations produce global scenarios of energy supply and demand. Figure 2 below illustrates change in recent and projected global demand from recent publically available scenarios (BP, EIA, Shell, IEA), indexed to 2010 levels. Figure 3 compares their conceptual relationship to the Reference and Evolving Scenarios, as well as the analysis in the “Towards Net Zero” section of EF2020.
Figure 2. Growth in Crude Oil and Natural Gas Demand – Various Global Scenarios (Indexed to 2010 levels, 2010=1.0)
Source and Description
Source: Calculated based on BP, EIA, IEA, Shell data.
Description: This scatter plot shows various projections from BP, EIA, IEA, and Shell of growth in global crude oil and natural gas demand, indexed to 2010 levels (we divide each organization’s values with their estimates of 2010 demands, which allows us to better compare across scenarios). 2020 natural gas demand is about 120% of 2010 levels, while 2020 crude oil demand is about 115% of 2010 levels. For natural gas, BP’s Business-as-usual scenario and the EIA’s 2019 Reference scenario increase into the future at a rate similar to recent years, reaching about 160% of 2010 levels by 2040. Conversely, BP’s Rapid scenario increases to 2035, but then decreases to about 130% of 2010 levels by 2050. Natural gas demand in Shell’s Sky scenario and BP’s Net-Zero scenario decrease to 2050 from current levels to 2010 levels and 80% of 2010 levels, respectively. For crude oil, the EIA’s Reference scenario increases from current levels to about 140% of 2010 levels by 2050. Shell’s Sky scenario and BP’s Business-as-usual scenario slightly decrease from current global demand to around 2010 levels by 2050. Finally, BP’s Rapid and Net-Zero scenarios, and the IEA’s Sustainable Development scenario dramatically decrease to between 30% and 60% of 2010 levels by 2050.
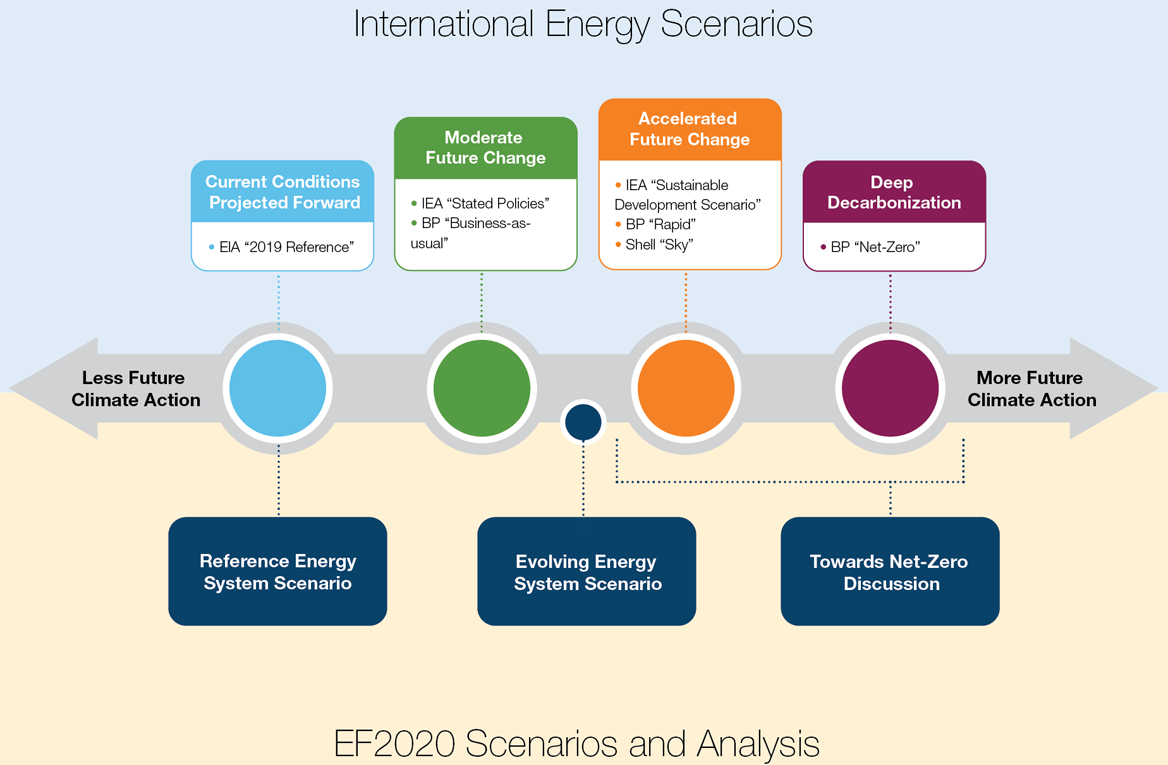
Figure 3. Illustration of Assumed Climate Action of Various Global Scenarios and EF2020 Scenarios and Analysis
Source and Description
Source: CER
Description: This figure shows international energy scenarios grouped into the following four categories: Current Conditions Projected Forward, Moderate Future Change, Accelerated Future Change, and Deep Decarbonization. The four categories are shown in this order from left to right above a horizontal axis, where left along the axis is less future climate action, and right along the axis is more future climate action. The CER’s Energy Futures 2020 scenarios are shown below the axis. The Reference Energy System Scenario corresponds to the current conditions moving forward category. The Evolving Energy System Scenario is shown to fit in between the Moderate Future Change and Accelerated Future Change categories. Finally, the Towards Net-Zero Discussion corresponds to a range encompassing both the Accelerated Future change category and the Deep Decarbonization category.
These global scenarios depict a broad range of future outcomes for international crude oil and natural gas demand. Canada is an important producer of both of these commodities; the ultimate evolution of demand for the commodities will be important drivers of Canada’s energy outlook. This is particularly true if the world moves closer to trajectories showing greater climate action. For example, relative to current levels, BP’s Net Zero scenario shows 69% and 34% reductions in global crude oil and natural gas demand, respectively. As mentioned in the EF2020 “Towards Net-Zero” section on future oil sands production, lower demand will likely imply a more competitive environment and lower benchmark prices for crude oil. Additionally, production could become more costly due to use of technologies that reduce upstream emissions, and an increased focus on ESG considerations in order to attract sufficient investment.
- Date modified: