ARCHIVED – Canada’s Renewable Power Landscape 2016 – Energy Market Analysis
This page has been archived on the Web
Information identified as archived is provided for reference, research or recordkeeping purposes. It is not subject to the Government of Canada Web Standards and has not been altered or updated since it was archived. Please contact us to request a format other than those available.
Executive Summary

Canada ranks fourth in the world in renewable power generation. Hydro is the dominant source of electricity in Canada accounting for nearly 60% of installed capacity and generation.
Five provinces and territories generated the vast majority of their electricity from hydro in 2015. The share of electricity production from hydro reached 86% in British Columbia (BC), 97% in Manitoba, 95% in Quebec, 95% in Newfoundland and Labrador, and 94% in Yukon.
Four provinces and territories have diverse electricity mixes relying on various combinations of nuclear, coal, gas, oil, and renewables. In 2015, the share of renewables in total generation reached 34% in Ontario, 28% in New Brunswick, 24% in Nova Scotia, and 38% in Northwest Territories (NWT).
Three provinces and territories relied primarily on fossil fuels for electricity in 2015: Alberta (90% of generation from coal and natural gas), Saskatchewan (83% of generation from coal and natural gas), and Nunavut (100% of generation from oil).
Nearly all of the power generated in Prince Edward Island (PEI) is from wind, but PEI also relies on power imported from nearby provinces to meet its total demand.
A decade ago, wind, solar, biomass, and other non-hydro renewables comprised just 2% of total Canadian capacity. Growth over the last decade has been very impressive, especially with wind capacity growing 1 900% and solar growing an astounding 12 500%. However, the total share of these technologies in 2015 was just 11% of capacity; and because solar and wind are intermittent, non-hydro renewables accounted for just 7% of generation.
Ontario and Nova Scotia have seen the largest gains in renewable power production over the last decade. Renewable power generation in Ontario increased from 23% to 34%. In Nova Scotia, the renewable generation share increased from 12% to 24%.
Despite various policies and programs in support of renewables, new capacity additions in Canada have been limited as a result of low growth in electricity demand and the long operating life of existing facilities. Cost concerns and local opposition have also limited growth opportunities.
11% of Canada’s greenhouse gas emissions (GHGs) come from the electricity sector. From 2000 to 2014 emissions from this sector declined 40% due primarily to the phase out of coal in Ontario and initiatives to reduce GHGs in Nova Scotia and New Brunswick.
Renewable capacity versus generation
Capacity is the maximum electric output a facility can produce while generation refers to the amount of power actually produced. Generation facilities cannot operate at full capacity 100% of the time because of maintenance and unplanned outages. Operating costs, market conditions, technological constraints, and the availability of the necessary resource also determine how much a generator runs.
The difference between generation and capacity is distinct in the case of intermittent renewables. For example, solar photovoltaics (PV) output is relative to sun intensity during daylight hours, and wind generation changes exponentially with wind speeds. Although wind and solar account for 9% of Canadian capacity in 2015, they only generated 5% of Canadian electricity.
Because of their efficiency and relatively low operating costs, some generation facilities are well suited to providing constant generation and meeting minimum system demands. For example, a nuclear reactor runs at fairly constant level over a long period of time.
Other facilities such as certain types of natural gas-fired plants, can be ramped up or shut down quickly, providing power during periods of peak demand.
Infographic
Text version of this graphic
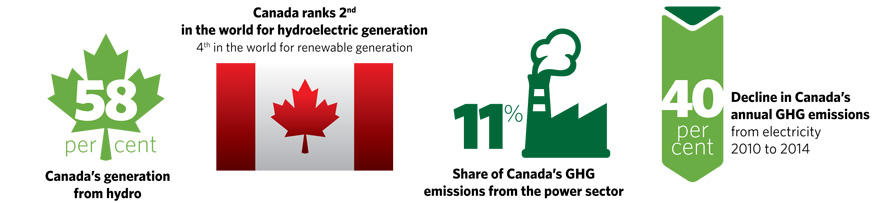
Canada’s generation from hydroelectricity is 58%.
Canada ranks 2nd in the world for renewable generation and 4th in the world for renewable generation.
11% of Canada’s GHG emissions come from electricity generation.
Canada’s annual GHG emissions from electricity declined 40% from 2000 to 2014.

Text version of this graphic
In 2015, wind capacity was 20 times what it was in 2005.
In 2015, solar capacity was 125 times what it was in 2005.
In 2015, these hydro rich areas generated almost all of their electricity from renewables:
- Yukon 94%
- British Columbia 94%
- Newfoundland and Labrador 96%
- Manitoba 99%
- Quebec 99%.
Text version of this graphic
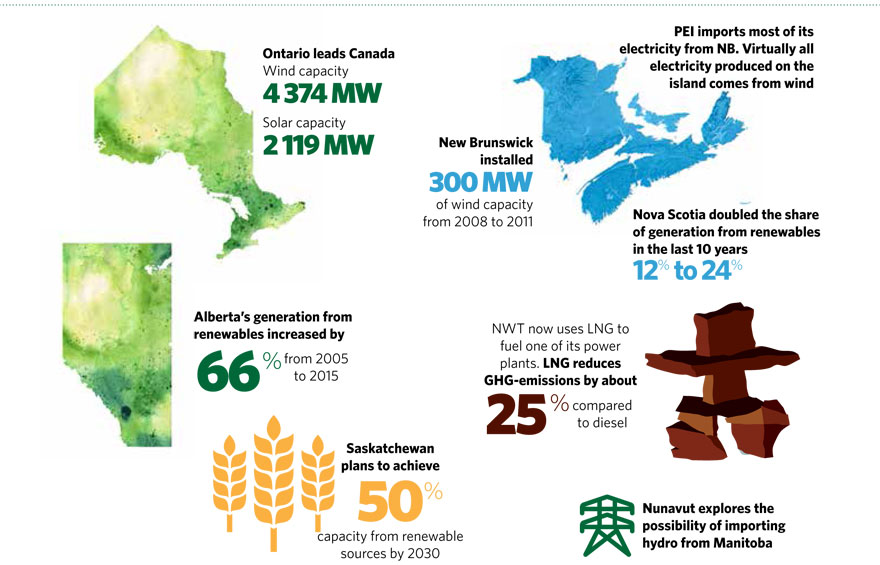
Ontario leads Canada in wind capacity (4 374 MW) and solar capacity (2 119 MW).
PEI imports most of its electricity from New Brunswick. Virtually all electricity produced on the PEI comes from wind.
New Brunswick installed 300 MW of wind capacity from 2008 to 2011.
Nova Scotia doubled its share of renewable generation in the last ten years (12% to 24%).
Saskatchewan plans to achieve 50% of capacity from renewable sources by 2030.
Alberta’s generation from renewables increased by 66% from 2005 to 2015.
NWT now uses LNG to fuel one of its power plants. LNG reduces GHG emissions by about 25% compared to diesel.
Nunavut explores the possibility of importing hydro from Manitoba.
- Date modified: