ARCHIVED – Canada’s Renewable Power Landscape 2016 – Energy Market Analysis
This page has been archived on the Web
Information identified as archived is provided for reference, research or recordkeeping purposes. It is not subject to the Government of Canada Web Standards and has not been altered or updated since it was archived. Please contact us to request a format other than those available.

Greenhouse Gas Emissions
In 2014, Canada emitted 732 megatons of carbon dioxide equivalent (Mt CO2 equivalent). Of these GHG emissions, 78% were carbon dioxide (CO2), primarily from fossil fuel combustion.
Methane (CH4) contributed 15%, with the remaining 7% comprised of various other types of emissions including hydrofluorocarbons, perfluorocarbons and sulfur hexafluoride generated in industrial processes.
11% of Canada’s GHG emissions came from electricity production. In other words, if Canada switched to 100% non-emitting sources of electricity generation, the nation’s GHG emissions would decline by 11%. In comparison, the power sector in the U.S. generated 30% of the country’s emissions in 2014.
Ontario’s GHG emissions from electricity decreased dramatically as a result of phasing out coal generation. Emissions decreased from 43 to 6 Mt CO2 equivalent from 2000 to 2014 as shown in the graph below.
Saskatchewan and Alberta have the highest emissions from the power sector. Alberta generated 57% of Canada’s electricity GHG emissions in 2014 and Saskatchewan accounted for 18%.
Using different types of electricity generation can reduce emissions. The difference in emissions between using thermal and non-thermal generation is the most pronounced, but using carbon capture and storage (CCS) technology or switching from higher-emitting thermal sources such as coal, oil, and diesel to cleaner-burning natural gas can also decrease emissions, especially if combined-cycle generators are used.
| Oil and Gas Production | 26% |
| Transportation | 23% |
| Buildings | 12% |
| Electricity | 11% |
| Emissions-Intensive and Trade Exposed IndustryNote a | 10% |
| Agriculture | 10% |
| Waste and Others | 7% |

FIGURE 1 Electricity Emissions by Region
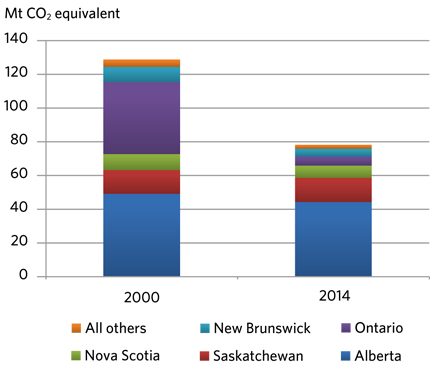
Text version of this graphic
This chart shows provincial and territorial GHG emissions from electricity production in 2000 and 2014. Total emissions from electricity production in Canada dropped from over 120 Mt CO2 equivalent in 2000 to under 80 Mt CO2 equivalent in 2014.
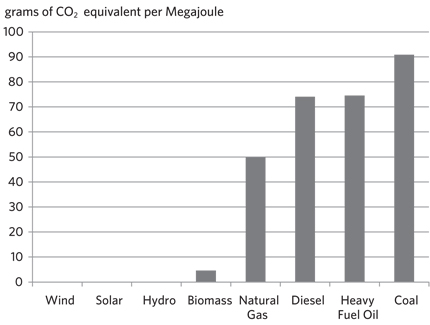
FIGURE 2 Emissions by Fuel Type
Sources:
National Inventory Report 1990-2014: Greenhouse Gas Sources and Sinks in Canada
Canada’s Emission Trends 2014
Text version of this graphic
This chart shows CO2 emissions by fuel type in grams of CO2 equivalent per megajoule. Coal emits the highest amount of CO2 at 90.87g/MJ, followed by heavy fuel oil at 74.58g/MJ, diesel at 74.08g/MJ, natural gas at 49.88g/MJ, and biomass at 4.59g/MJ. There are no emissions from hydro, wind, or solar.
- Date modified: