Provincial and Territorial Energy Profiles – Nova Scotia

On this page:
Connect/Contact Us
Please send comments, questions, or suggestions to
energy-energie@cer-rec.gc.ca
-
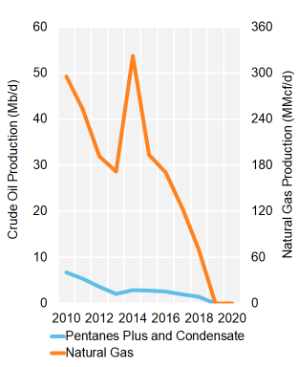
Figure 1: Hydrocarbon Production
Source and Description:
Source:
CER – Estimated Production of Canadian Crude Oil and Equivalent and Marketable Natural Gas Production in CanadaDescription:
This graph shows hydrocarbon production in Nova Scotia from 2013 to 2023. Over this period, condensate and pentanes plus production has decreased from 2.9 Mb/d to zero. Natural gas production has deceased over this period from 171.5 MMcf/d to zero. -
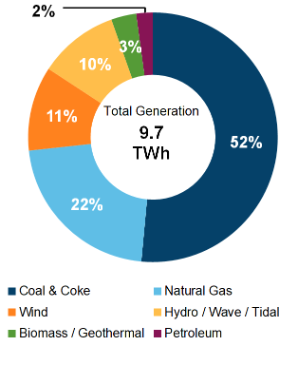
Figure 2: Electricity Generation by Fuel Type (2021)
Source and Description:
Source:
CER – Canada's Energy Future 2023 Data Appendix for Electricity GenerationDescription:
This pie chart shows electricity generation by source in Nova Scotia. A total of 8.5 TWh of electricity was generated in 2021. -
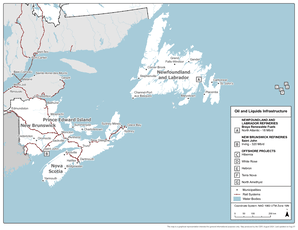
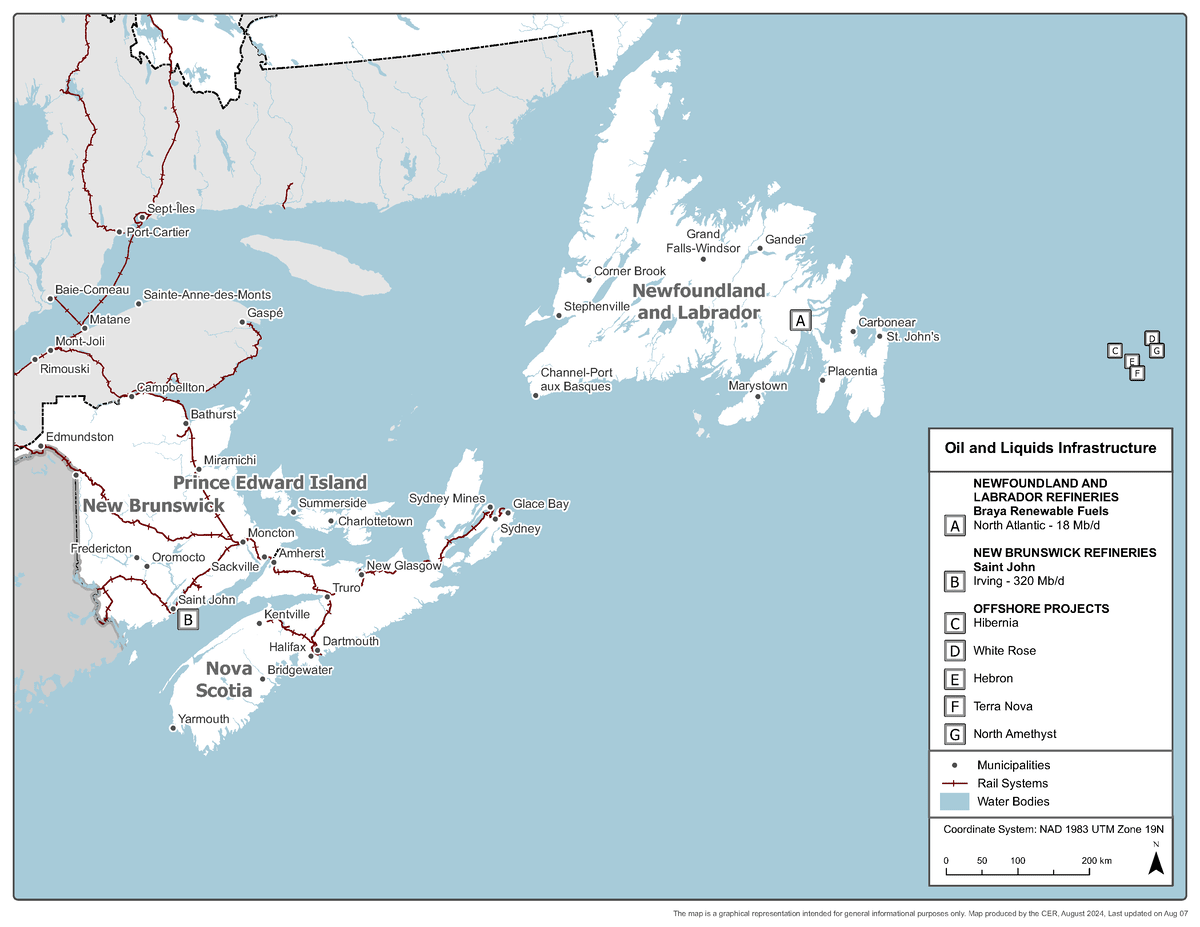
Figure 3: Crude Oil Infrastructure Map
Source and Description:
Source:
CERDescription:
This map shows rail lines in Nova Scotia and crude oil infrastructure in Atlantic Canada.Download:
PDF version [2,817 KB] -
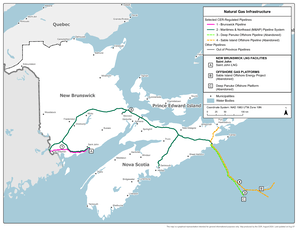
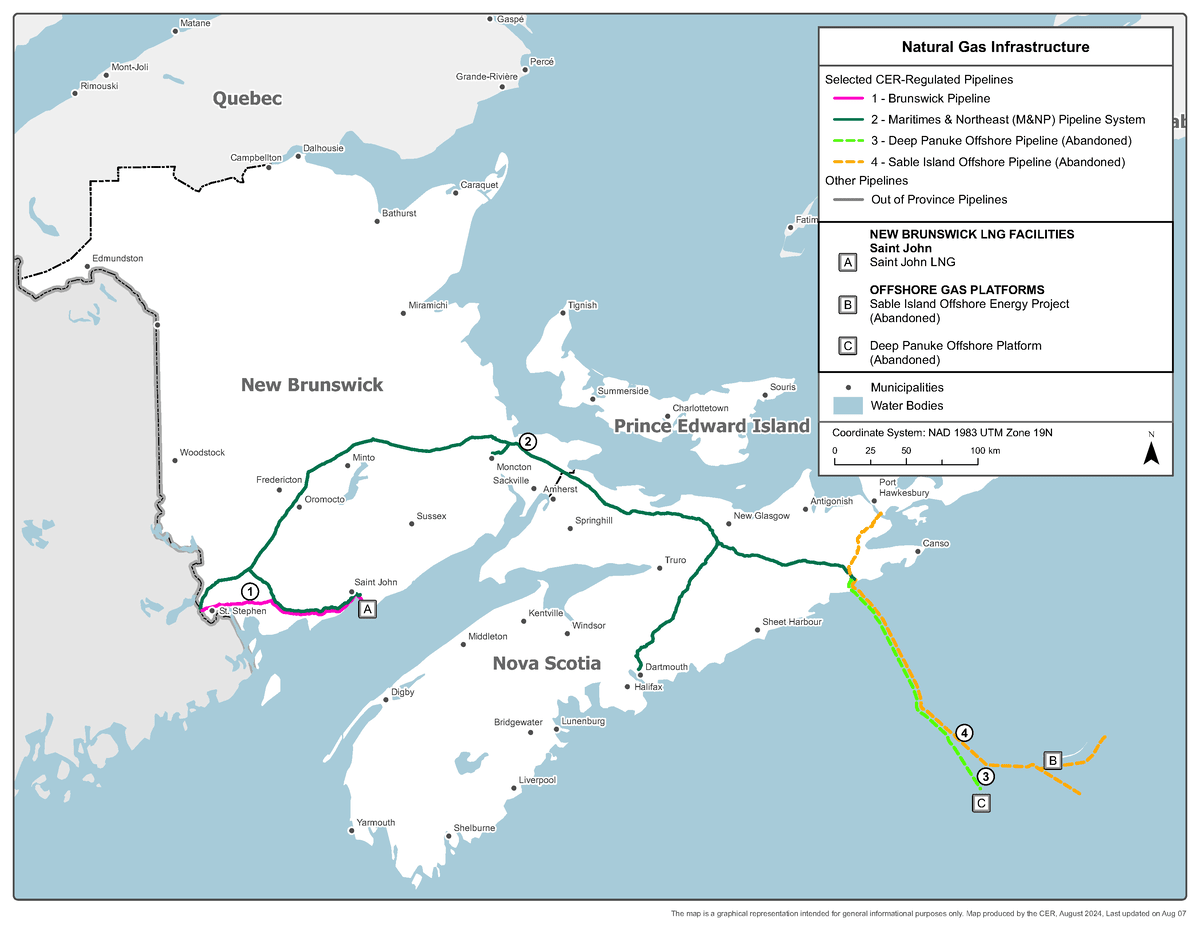
Figure 4: Natural Gas Infrastructure Map
Source and Description:
Source:
CERDescription:
This map shows major CER-regulated natural gas pipelines, offshore natural gas platforms, and the Saint John LNG terminal in the Maritimes.Download:
PDF version [686 KB] -
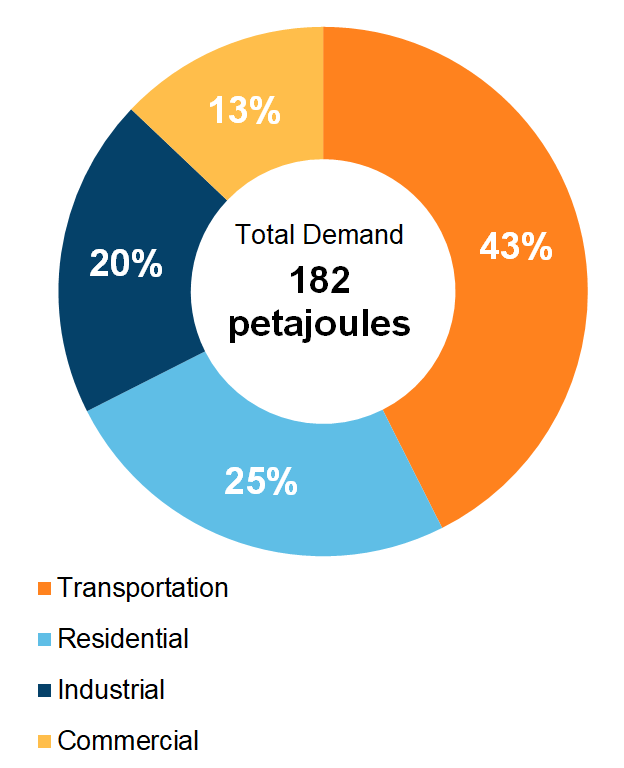
Figure 5: End-Use Demand by Sector (2020)

Source and Description:
Source:
CER – Canada's Energy Future 2023 Data Appendix for End-Use DemandDescription:
This pie chart shows end-use energy demand in Nova Scotia by sector. Total end-use energy demand was 156 PJ in 2020. The largest sector was transportation at 39% of total demand, followed by residential (at 28%), industrial (at 18%), and lastly, commercial (at 15%). -
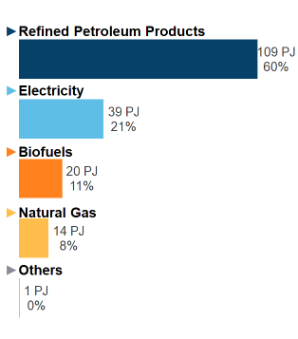
Figure 6: End-Use Demand by Fuel (2020)
Source and Description:
Source:
CER – Canada's Energy Future 2023 Data Appendix for End-Use DemandDescription:
This figure shows end-use demand by fuel type in Nova Scotia in 2020. Refined petroleum products accounted for 92 PJ (59%) of demand, followed by electricity at 37 PJ (23%), biofuels at 17 PJ (11%), natural gas at 11 PJ (7%), and other at 0 PJ.
Note: "Other" includes coal, coke, and coke oven gas. -
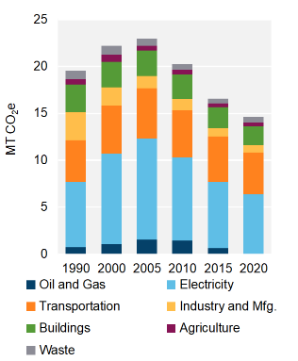
Figure 7: GHG Emissions by Sector
Source and Description:
Source:
Environment and Climate Change Canada – National Inventory Report 1990-2022Description:
This stacked column graph shows GHG emissions in Nova Scotia by sector from 1990 to 2022 in MT of CO2e. Total GHG emissions have decreased in Nova Scotia from 19.6 MT of CO2e in 1990 to 14.8 MT of CO2e in 2022. -
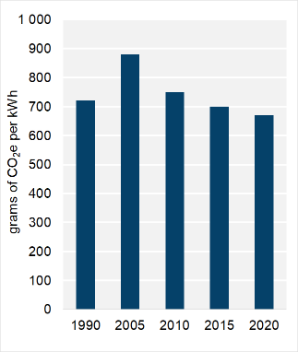
Figure 8: Emissions Intensity from Electricity Generation
Source and Description:
Source:
Environment and Climate Change Canada – National Inventory Report 1990-2022Description:
This column graph shows the emissions intensity of electricity generation in Nova Scotia from 1990 to 2022. In 1990, electricity generated in Nova Scotia emitted 720 g of CO2e per kWh. By 2022, emissions intensity decreased to 660 g of CO2e per kWh.


Energy Production
Crude Oil
- Since 2018, Nova Scotia has not produced any crude oil or crude oil equivalents (Figure 1).
- Between 2000 and 2018, Nova Scotia produced condensate/pentanes plus at the ExxonMobil-operated Point Tupper Fractionator Plant. In 2018, ExxonMobil applied to the province to abandon its fractionator as part of the abandonment of its natural gas producing Sable Offshore Energy Project.Footnote 1 Production at Point Tupper ceased by May 2018.
- There are currently no active exploration licenses or projects in the offshore of Nova Scotia.
Refined Petroleum Products (RPPs)
- Nova Scotia does not have any refineries. Imperial Oil’s Dartmouth refinery closed in 2013. The facility now operates as an oil products terminal.
- In April 2022, NuStar Energy L.P. sold its 7.8 million-barrel storage terminal in Point Tupper to EverWind Fuels. The terminal is one of the largest RPP storage and blending facilities in Atlantic Canada. It serves markets in Atlantic Canada and the United States (U.S.) East Coast. EverWind plans to turn the terminal into Atlantic Canada’s first green ammonia production facility in 2026.Footnote 2
Natural Gas/Natural Gas Liquids (NGLs)
- Nova Scotia has not produced any natural gas since 2018. (Figure 1)
- Natural gas in Nova Scotia was previously produced offshore at ExxonMobil’s Sable Offshore Energy Project and Ovintiv’s Deep PanukeFootnote 3 project until 2018 (Encana changed its name to Ovintiv in 2020).
- The Sable Offshore Energy Project, Canada’s first offshore natural gas project, was commissioned in 1999 and ceased production on 31 December 2018. The plugging and abandonment of all wells was completed in 2019. A post-abandonment monitoring program was conducted in 2021 and the project was officially closed.
- Deep Panuke was commissioned in 2013 and ceased production in May 2018. The plugging and abandonment of Deep Panuke’s five wells was completed in August 2020. A post-abandonment monitoring program was completed in 2021 and the project was officially closed.Footnote 4
- Nova Scotia currently produces no NGLs. Previously, NGLs were produced from natural gas from the Sable Offshore Energy Project, which were then processed at the Goldboro gas plant. NGLs from Goldboro were then shipped by pipeline to the Point Tupper plant for fractionation into propane, butane, and pentanes plus. The gas plant, pipeline, and fractionation plant were shut down when Sable Offshore Energy Project permanently ceased production. Infrastructure associated with gas production, including the gas plant, pipeline, and fractionation plant, has been shut down.
- Since 2012, a prohibition on high-volume hydraulic fracturing for onshore gas development in shale formations has been in place in Nova Scotia.
- Nova Scotia’s offshore exploration and production is regulated by the Canada-Nova Scotia Offshore Petroleum Board (CNSOPB).Footnote 5 In April 2022, the Government of Canada and the Province of Nova Scotia announced the intent that the CNSOPB will expand its mandate to include the regulation of offshore renewable energy development, and that it would be renamed to the Canada-Nova Scotia Offshore Energy Board (CNSOEB) to reflect its new mandate.Footnote 6
Electricity
- In 2021, Nova Scotia generated 8.5 terawatt-hours (TWh) of electricity (Figure 2), which is 1% of total Canadian generation. Nova Scotia has an estimated generating capacity of 2,839 megawatts (MW).
- Nova Scotia Power, a subsidiary of Emera, generates most of Nova Scotia’s electricity, with 2,400 MW of capacity.Footnote 7
- In 2021, about 55% of electricity generation was from coal, with the remainder coming from natural gas, wind, hydro, biomass, and oil. However, Nova Scotia has made recent progress and continues to take steps toward advancing its Clean Power Plan.Footnote 8
- Nova Scotia Power operates coal and coke generating stations, including Lingan (620 MW), Point Aconi (171 MW), Point Tupper (154 MW), and Trenton (307 MW).Footnote 9
- The Tufts Cove Generating Station (500 MW) in Dartmouth can burn oil or natural gas to generate electricity. In recent years, it has run largely on natural gas.Footnote 10
- On 5 November 2021, the province passed the Environmental Goals and Climate Change Reduction Act,Footnote 11 a successor to 2007’s Environmental Goals and Sustainable Prosperity Act. The new act puts numerous climate change goals over the next decade into law, including phasing out coal-fired electricity generation and producing 80% of electricity from renewables by 2030.
- During 2023, Nova Scotia Power generated 42.5% of electricity from renewables as required by Nova Scotia’s 2010 Renewable Electricity Regulations under the Electricity Act.Footnote 12 The Province anticipates reaching its legislated 2030 goals primarily through new onshore wind projects and imports from Labrador’s Muskrat Falls via the Maritime Link.
- There are more than 300 commercial wind turbines generating electricity in Nova Scotia, with an estimated generating capacity of 603 MW. Most wind facilities are owned by independent power producers.
- In 2023, Nova Scotia approved twelve clean energy projects: ten wind projects, and two green hydrogen/ammonia projects.
- The Offshore Wind Roadmap establishes the framework for building wind farms in ocean waters that are jointly managed with the federal government.Footnote 13 It will help the province achieve the goal of issuing leases for five gigawatts of offshore wind energy by 2030.
- Nova Scotia Power operates 33 hydroelectric plants on 17 hydro river systems across Nova Scotia, totaling 400 MW of generation capacity.
- Nova Scotia Power also operates a 60 MW bioenergy plant in Port Hawkesbury that provides as much as 3% of the province’s electricity.
- Built in 1984, the Annapolis Royal Tidal Station was the first tidal power generating station in North America. It had 20 MW of generating capacity. It was shut down in January 2019 because of a generator failure and an order issued from the Government of Canada’s Department of Fisheries and Oceans.
- Fundy Ocean Research Centre for Energy (FORCE)Footnote 14 is a not-for-profit research and test centre for tidal energy located in the Bay of Fundy’s Minas Passage. FORCE’s partners include the Province of Nova Scotia, the Government of Canada, tidal energy developers, academic institutions, and environmental groups. The test site consists of five subsea berths for the deployment of tidal stream devices and subsea cables to enable devices to connect to onshore infrastructure. The generating capacity of all licensed projects at the FORCE test site is 22 MW, although, no projects are currently deployed.
- In February 2024, the Government of Canada released a report to guide tidal energy projects in the Bay of Fundy.Footnote 15 The report identifies four key issues that are critical to the tidal energy sector in the Bay of Fundy, introduces a revised staged approach for project development, provides recommendations, and discusses the importance of advancing research and monitoring.
Hydrogen
- In 2022, EverWind Fuels proposed converting the former NuStar Energy RPP storage and blending terminal in Point Tupper into a green hydrogen and green ammonia production hub.Footnote 16 The project received approval from Nova Scotia’s Minister of Environment and Climate Change in February 2023. The project’s first phase, producing 240,000 tonnes of green ammonia per year, is expected to be online in 2026.Footnote 17
- In April 2023, Nova Scotia’s Minister of Environment and Climate Change approved Bear Head Energy’s green hydrogen and green ammonia production plant in Point Tupper.Footnote 18 The plant will have the capacity to produce up to 350,000 tonnes of hydrogen each year, which it will then convert into two million tonnes of ammonia each year before shipping to customers overseas. Initial engineering design work is currently underway, with first production expected by 2028.
- In December 2023, Nova Scotia released its Green Hydrogen Action Plan.Footnote 19
Energy Transportation and Trade
Crude Oil and Liquids
- There are no crude oil pipelines or crude-by-rail facilities in Nova Scotia.
- Since Nova Scotia is not connected to oil pipeline systems and it does not have any refineries, it must import RPPs. RPPs are imported from the Irving Refinery in New Brunswick, as well as other countries including the U.S., the Netherlands, and Belgium.
Natural Gas
- Nova Scotia relies entirely on imported natural gas, which arrives via the Maritimes and Northeast PipelineFootnote 20 (M&NP) (Figure 3). The M&NP connects to pipelines in the northeast U.S., which are connected to the broader, North American market, including western Canada. The Canadian portion of the M&NP starts at St. Stephen, New Brunswick, and ends near Halifax and Goldboro in Nova Scotia. In 2023, the M&NP shipped 189 MMcf/d of gas into Nova Scotia and New Brunswick. Some Nova Scotia companies ship gas all the way from western Canada to Nova Scotia through multiple transmission pipelines.
- Nova Scotia also receives some gas supply in the form of liquefied natural gas (LNG), which is imported into Canada from global sources to the Saint John LNG import terminal in New Brunswick.Footnote 21 Imported LNG is transported through New Brunswick on the Emera Brunswick Pipeline to a connection with the M&NP.Footnote 22 Once on the M&NP, the gas can flow north to delivery points in New Brunswick and Nova Scotia or south to delivery points in the northeast U.S.
- The M&NP was originally built to transport natural gas from offshore Nova Scotia to markets in the U.S. northeast, but no longer exports gas to any significant degree. Until 2017, exports on the M&NP exceeded imports, but with the decline (and end) of Nova Scotia’s offshore production, the M&NP is a net-importing pipeline. In 2023, only 0.02 MMcf/d was exported.
- Nova Scotia does not have any underground natural gas storage facilities, so it must rely on pipeline imports to meet natural gas demand. Alton Natural Gas Storage LP, a subsidiary of AltaGas, had received environmental approvalFootnote 23 from the province in 2013 to develop a natural gas underground storage facility near Alton. In October 2021, AltaGas decided not to continue with development of the project. Decommissioning work began in 2023.Footnote 24
Liquefied Natural Gas (LNG)
- In November 2023, Pieridae Energy announced that it would abandon plans to build the Goldboro LNG export project in Nova Scotia and sell the Goldboro assets.Footnote 25 The sale was finalized in July 2024.Footnote 26 The $3 billion facility was proposed in 2012 to export 320 MMcf/d of natural gas to European markets. Pieridae Energy had previously received authorization from the Nova Scotia Utilities and Review Board (NSUARB)Footnote 27 to construct Goldboro LNG export facility and an export and import licence from the NEB (now CER).Footnote 28
- Bear Head LNG Project was initially proposed in 2001 as an LNG terminal in the Strait of Canso.Footnote 29 The project received authorization from the NSUARB to construct the facility and an export and import licence from the NEB.Footnote 30 In 2021, Bear Head began to transition the project from LNG to low-carbon hydrogen and ammonia.
Electricity
- In 2023, Nova Scotia had 2.8 TWh of net interprovincial and international electricity inflows.
- A 350 MW transmission line connects Nova Scotia with New Brunswick, enabling the trade of electricity between the two provinces. A new project, called the NS-NB Reliability Tie,Footnote 31 is underway. Nova Scotia Power is constructing a new 350 MW transmission line parallel to the existing line. Nova Scotia’s Minister of Environment and Climate Change approved the project in December 2023. Construction is planned to be completed by the end of 2027.
- The Maritime Link ProjectFootnote 32 was placed into service in January 2018 and connects Nova Scotia’s electrical grid with the Muskrat Falls hydro facility in Labrador.Footnote 33 The project consists of over 300 km of overland transmission on the island of Newfoundland, two 170 km subsea cables across the Cabot Strait, and 50 km of overland transmission in Nova Scotia. First power from Muskrat Falls was received by Nova Scotia in August 2021. Deliveries of electricity ramped up to between 70% and 100% of contracted amounts starting in December 2021.
- The Atlantic Loop project was initially proposed as a series of high-capacity transmission lines looping together Hydro-Québec and Newfoundland and Labrador Hydro assets with New Brunswick and Nova Scotia.Footnote 34 In October 2023, Nova Scotia stated that the Atlantic Loop is no longer viable for 2030 due to affordability and availability concerns, but the Province will continue to expand electricity imports regionally through the Maritime Link and existing ties with New Brunswick to meet targets.
- Nova Scotia has roughly 32,000 km of transmission and distribution lines and Nova Scotia PowerFootnote 35 operates most of the power transmission and distribution lines in the province. Nova Scotia Power is regulated by the NSUARB and serves approximately 540,000 residential, commercial, and industrial customers.
Energy Consumption and Greenhouse Gas (GHG) Emissions
Total Energy Consumption
- End-use demand in Nova Scotia was 156 petajoules (PJ) in 2020. The transportation sector was responsible for 39% of total demand, followed by residential at 28%, industrial at 18%, and commercial at 15% (Figure 4). Nova Scotia’s total energy demand was the eighth largest in Canada, and the eleventh largest on a per capita basis.
- RPPs, including gasoline, diesel, and heating oil, were the most consumed fuel in Nova Scotia, accounting for 92 PJ, or 59% of total end-use demand. Electricity and biofuels accounted for 37 PJ (23%) and 17 PJ (11%), respectively (Figure 5).
Refined Petroleum Products
- Nova Scotia’s motor gasoline demand in 2022 was 1,211 litres per capita, 17% above the national average of 1,035 litres per capita.
- Nova Scotia’s diesel demand in 2022 was 618 litres per capita, 20% below the national average of 772 litres per capita.
- RPP prices in Nova Scotia have been regulated by the NSUARB since 2009. The NSUARB sets wholesale prices, minimum and maximum retail mark-ups, and maximum retail prices for gasoline and diesel.Footnote 36
Natural Gas
- In 2023, Nova Scotia consumed an average of 77.2 MMcf/d of natural gas, which was less than 1% of total Canadian demand.
- Nova Scotia’s industrial sector consumed 57.7 MMcf/d of natural gas in 2023. The commercial and residential sectors consumed 18.7 MMcf/d and 0.7 MMcf/d, respectively.
Electricity
- In 2020, annual electricity consumption per capita in Nova Scotia was 10.4 megawatt-hours (MWh). Nova Scotia ranked ninth in Canada for per capita electricity consumption and consumed 29% less than the national average.
- Nova Scotia’s largest consuming sector for electricity in 2020 was residential at 4.8 TWh. The commercial and industrial sectors consumed 3.4 TWh and 2.0 TWh, respectively.
GHG Emissions
- Nova Scotia’s GHG emissions in 2022 were 14.8 megatonnes of carbon dioxide equivalent (MT CO2e).Footnote 37 Nova Scotia’s emissions have declined 25% since 1990 and 35% since 2005. The Environmental Goals and Climate Change Reduction Act’sFootnote 38 targets are to reduce greenhouse gas emissions by at least 53% below 2005 levels by 2030 and achieve net-zero greenhouse gas emissions by 2050.
- Nova Scotia emissions per capita are 14.4 tonnes CO2e, which is 21% below the Canadian average of 18.2 tonnes per capita.
- The largest emitting sectors in Nova Scotia are electricity generation at 39% of emissions, transportation at 35%, and buildings (residential and commercial) at 14% (Figure 6).
- In 2022, Nova Scotia’s power sector emitted 5.8 MT CO2e emissions, which represents about 12% of Canadian emissions from power generation.
- The greenhouse gas intensity of Nova Scotia’s electricity grid was 660 grams of CO2e per kilowatt-hour (g of CO2e/kWh) electricity generated in 2022. This is a 25% reduction from the province’s 2005 level of 880 g of CO2e/kWh. The national average in 2022 was 100 g of CO2e/kWh (Figure 7).
Energy Authorities
- Canada-Nova Scotia Offshore Petroleum Board
- Nova Scotia Department of Energy
- CER–Canada's Renewable Power: Nova Scotia
- Date modified: