The CER has issued an errata to correct several errors in the report
Key Findings

Canada’s Energy Transition
Low-carbon Electricity
Wind and
Solar
Diverse Electricity Grids
Crude Oil Production
Natural Gas Production
Fossil Fuel Demand
![]() Net-Zero Key Findings
Net-Zero Key Findings
Canada’s Energy Transition
1. In the Evolving Policies Scenario, combustion of fossil fuels whose emissions are not captured falls 62% from 2021 to 2050, while use of low and non-emitting energy sources increases. While this implies a significant reduction in GHG emissions by 2050, achieving net-zero will likely require more change than is included in this scenario.
Figure ES.2: Total Canadian Energy Use, Evolving Policies Scenario

Click to enlarge
Figure ES.3: Unabated Fossil Fuel Use, Evolving Policies Scenario

Click to enlarge
Figure ES.2 Description
Description: This figure shows two charts. The first stacked area chart compares low emissions energy demand with unabated fossil fuel energy demand in the Evolving Policies Scenario. The vertical axis units are Petajoules (PJ), and the horizontal axis shows years from 2005 to 2050. In 2021, unabated fossil fuel energy demand is about 9 300 PJ, and low emissions energy demand is about 4 200 PJ. By 2050, the share of unabated fossil fuel energy demand is about 3 500 PJ, and low-emission energy demand is about 7 200 PJ. The second chart compares shares of low-emission and unabated fossil fuel energy demand in 2021 and 2050 in the Evolving Policies Scenario. In 2021, the share of low emissions energy demand is 31%, and 66% by 2050, with unabated fossil fuel energy demand making up the remainder.
Figure ES.3 Description
Description: This bar chart shows unabated fossil fuel consumption in the years 2005, 2021, 2030, 2040, and 2050. In 2005 unabated fossil fuel consumption was 8 900 PJ. In 2021, unabated fossil fuel consumption is 9 300 PJ. In 2030, unabated fossil fuel consumption falls by 19% from current levels to 7 600 PJ. In 2040, unabated fossil fuel consumption falls by 45% from current levels to 5 000 PJ. By 2050, unabated fossil fuel consumption falls by about 62% from current levels to 3 500 PJ.

In the Evolving Policies Scenario, Canadians reduce their energy consumption and adopt lower carbon sources (Figure ES.2). Total primary energy use falls 21% from 2021 to 2050 as energy efficiency improves. Low and non-emitting sources–including renewables, nuclear, and fossil fuels with carbon-capture and storage (CCS)Definition * grow to make up the strong majority of energy use. Unabated fossil fuel combustion (fossil fuel combustion without CCS) falls 19% from current levels by 2030, 45% by 2040, and 62% by 2050 (Figure ES.3).
Policy assumptions in the Evolving Policies Scenario are based on strengthening or expanding existing global and domestic policies at a pace consistent with recent trends. The Evolving Policies Scenario projections show significant changes in Canada’s energy system and imply large reductions in GHG emissions. However, given the remaining unabated fossil fuel demands in 2050, the Evolving Policies Scenario also signals the need for greater long-term change in order to reach Canada’s target of net-zero emissions by 2050. In addition to policy, many other factors we discuss in EF2021–such as global energy markets, technology, and consumer behaviour and preferences–will also influence future Canadian energy and emission trends.
Low-carbon Electricity
2. Canadians use more electricity, from increasingly low-carbon sources. Despite total energy use declining, electricity demand grows 47% from 2021 to 2050 in the Evolving Policies Scenario, much of it from new areas such as electric vehicles and hydrogen production. Canada’s electricity system also gets greener, going from 82% low and non-emitting in 2021 to 95% in 2050.
Figure ES.4: Electricity Demand by Sector, Evolving Policies Scenario
Figure ES.5: Electricity Generation by Source, Evolving Policies Scenario

Click to enlarge
Figure ES.4 Description
Description: This chart breaks down total electricity demand by sector. Residential demand increases from 171 TWh in 2019 to 217 by 2050. Commercial demand decreases from 150 TWh in 2019 to 134 by 2050. Industrial demand increases from 239 TWh in 2019 to 280 by 2050. Transportation demand increases from 1 TWh in 2019 to 93 by 2050. Hydrogen Production demand increases from 0 TWh in 2019 to 90 TWh by 2050.
Figure ES.5 Description
Description: This chart breaks down total electricity generation by source. Wind generation increases from 32 TWh in 2019 to 159 TWh by 2050. Solar generation increases from 2 TWh in 2019 to 35 TWh by 2050. Natural gas generation decreases from 70 TWh in 2019 to 36 TWh by 2050. Natural gas generation with carbon capture and storage increases from 0 TWh in 2019 to 33 TWh by 2050. Hydro / wave / tidal generation increases from 376 TWh in 2019 to 446 TWh by 2050. Oil generation increases from 4 TWh in 2019 to 6 TWh by 2050. Biomass / geothermal generation decreases from 9 TWh in 2019 to 8 TWh by 2050. Coal and coke generation decreases from 44 TWh in 2019 to 0 TWh by 2050. Uranium generation increases from 95 TWh in 2019 to 96 TWh by 2050.
Compared to the past two decades when electricity use grew very slowly, electricity demand grows quickly over the projection period in the Evolving Policies Scenario. This increase is driven by increased electrification of the energy system. Total electricity demand increases by 47% from 2021 to 2050, or by about 263 terawatt hours (TWh) (Figure ES.4). Half of this increase is driven by increased electrification in the industrial, residential, and commercial sectors. The other half comes from electric vehicles in transportation and the production of hydrogen. In particular, by 2050, electric vehicles dominate Canada’s vehicle mix and increase electricity demand by 70 TWh. This results from the Evolving Policies Scenario assuming nearly all new passenger vehicles sold in 2035 are battery or plug-in hybrid electric vehicles.
As demand grows, Canadian electricity generation increases. Wind and solar generation provide much of this additional electricity over the projection period, given their low cost. Natural gas generation is increasingly equipped with CCS. Low and non-emitting electricity generation make up 82% of total generation in 2021, rising to 88% by 2030, 94% by 2040, and 95% by 2050.
Wind and Solar
3. Wind, solar, and battery storage dominate electric capacity additions in all six net-zero electricity scenarios, making up between 82-85% of added capacity. With rising levels of wind and solar, all scenarios require flexible generation sources to balance supply and demand. There are large differences in the types and capacities of flexible generation sources adopted among scenarios.
Figure ES.6: Cumulative Capacity Additions to 2050, All Net-Zero Electricity Scenarios

Description
Description: This graph shows the amount of capacity that is added between 2019 and 2050 for the following scenarios: NZE Base, Higher Carbon Price, Higher Demand, Limited Transmission, Hydrogen, and BECCS. For the NZE Base scenario, natural gas is 14 GW, natural gas with CCS is 6 GW, nuclear is 7 GW, hydro is 4 GW, solar is 58 GW, wind is 61 GW, and storage is 52 GW. For the Higher Carbon Price scenario, natural gas is 10 GW, natural gas with CCS is 2 GW, nuclear is 15 GW, hydro is 8 GW, solar is 56 GW, wind is 59 GW, and storage is 55 GW. For the Higher Demand scenario, natural gas is 17 GW, natural gas with CCS is 7 GW, nuclear is 10 GW, hydro is 5 GW, solar is 80 GW, wind is 75 GW, and storage is 68 GW. For the Limited Transmission scenario, natural gas is 13 GW, natural gas with CCS is 10 GW, nuclear is 7 GW, hydro is 2 GW, solar is 57 GW, wind is 59 GW, and storage is 55 GW. For the Hydrogen scenario, natural gas is 10 GW, natural gas with CCS is 4 GW, hydro is 4 GW, solar is 56 GW, wind is 56 GW, hydrogen is 14 GW and storage is 42 GW. For the BECCS scenario, natural gas is 13 GW, natural gas with CCS is 3 GW, biomass with CCS is 6 GW, nuclear is 7 GW, hydro is 4 GW, solar is 52 GW, wind is 55 GW, and storage is 50 GW.
The net-zero electricity scenarios each have a unique set of assumptions that examine many factors including technology, policies, level of electrification, and infrastructure. Figure ES.6 shows the net capacity additions for all six scenarios from 2019 to 2050. Consistent across all scenarios are large additions of wind and solar capacity, ranging from 100 gigawatts (GW) to 150 GW. These technologies are increasingly adopted due to their assumed low future costs in all scenarios. With large amounts of wind and solar capacity, power systems require additional flexible generating resources to balance supply and demand (given the variability of wind and sun conditions). Across the net-zero scenarios, the flexible generating resources are a combination of battery storage, natural gas-fired generation (with and without CCS), small modular nuclear reactors, hydropower, hydrogen-fired generation, biomass-fired generation with CCS, and transmission between provinces. The relative share of these flexible resources varies significantly across the scenarios, though the role of storage in balancing the grid increases dramatically in all scenarios.
Electricity Emissions in a Net-Zero World
In these scenarios, the emissions from the electricity sector drops dramatically, but a very small amount of emissions remains from natural gas-fired plants in five of the six scenarios. We allow these emissions because the value of these facilities in terms of electricity system reliability and stability is high. This allowance reflects that, in the context of a broader net-zero world, the use of carbon removal options could potentially provide more cost-effective options than reducing those last few emissions from the electricity system in 2050.
Diverse Electricity Grids
4. The net-zero electricity scenarios suggest that Canadian power systems will continue to be very distinct across the country, even in a low-carbon future. In each net-zero electricity scenario, the ten provinces meet their electricity demands in diverse ways, with widely varying mixes of hydro, nuclear, fossil fuel with CCS, wind, solar, hydrogen, and biomass with CCS.
Figure ES.7: Electricity Generation Share by Technology, Main Net-Zero Electricity Scenario

Description
Description: This chart provides electricity generation shares in percentages by technology for each of the provinces in the NZE Base scenario, as follows:
Alberta
| Technology | 2019 | 2030 | 2050 |
|---|---|---|---|
| Hydro | 3 | 4 | 2 |
| Natural Gas | 55 | 31 | 4 |
| Natural Gas CCS | 0 | 8 | 13 |
| Nuclear | 0 | 0 | 0 |
| Other Fossil | 37 | 0 | 0 |
| Solar | 0 | 0 | 13 |
| Wind | 6 | 56 | 68 |
British Columbia
| Technology | 2019 | 2030 | 2050 |
|---|---|---|---|
| Hydro | 92 | 95 | 67 |
| Natural Gas | 5 | 0 | 0 |
| Natural Gas CCS | 0 | 8 | 13 |
| Nuclear | 0 | 0 | 0 |
| Other Fossil | 1 | 0 | 0 |
| Solar | 0 | 0 | 4 |
| Wind | 3 | 5 | 29 |
Manitoba
| Technology | 2019 | 2030 | 2050 |
|---|---|---|---|
| Hydro | 97 | 97 | 75 |
| Natural Gas | 0 | 0 | 0 |
| Natural Gas CCS | 0 | 0 | 0 |
| Nuclear | 0 | 0 | 0 |
| Other Fossil | 0 | 0 | 0 |
| Solar | 0 | 0 | 3 |
| Wind | 3 | 3 | 21 |
New Brunswick
| Technology | 2019 | 2030 | 2050 |
|---|---|---|---|
| Hydro | 23 | 16 | 9 |
| Natural Gas | 15 | 9 | 4 |
| Natural Gas CCS | 0 | 0 | 0 |
| Nuclear | 39 | 34 | 24 |
| Other Fossil | 16 | 5 | 0 |
| Solar | 0 | 0 | 10 |
| Wind | 7 | 36 | 53 |
Newfoundland and Labrador
| Technology | 2019 | 2030 | 2050 |
|---|---|---|---|
| Hydro | 96 | 100 | 99 |
| Natural Gas | 1 | 0 | 0 |
| Natural Gas CCS | 0 | 0 | 0 |
| Nuclear | 0 | 0 | 0 |
| Other Fossil | 3 | 0 | 0 |
| Solar | 0 | 0 | 0 |
| Wind | 0 | 0 | 1 |
Nova Scotia
| Technology | 2019 | 2030 | 2050 |
|---|---|---|---|
| Hydro | 11 | 7 | 3 |
| Natural Gas | 23 | 4 | 1 |
| Natural Gas CCS | 0 | 0 | 0 |
| Nuclear | 0 | 0 | 0 |
| Other Fossil | 55 | 25 | 0 |
| Solar | 0 | 0 | 11 |
| Wind | 11 | 64 | 85 |
Ontario
| Technology | 2019 | 2030 | 2050 |
|---|---|---|---|
| Hydro | 24 | 13 | 9 |
| Natural Gas | 8 | 6 | 2 |
| Natural Gas CCS | 0 | 0 | 0 |
| Nuclear | 60 | 40 | 41 |
| Other Fossil | 0 | 0 | 0 |
| Solar | 1 | 3 | 15 |
| Wind | 7 | 38 | 33 |
Quebec
| Technology | 2019 | 2030 | 2050 |
|---|---|---|---|
| Hydro | 94 | 92 | 72 |
| Natural Gas | 0 | 1 | 1 |
| Natural Gas CCS | 0 | 0 | 0 |
| Nuclear | 0 | 0 | 0 |
| Other Fossil | 0 | 0 | 0 |
| Solar | 0 | 1 | 5 |
| Wind | 5 | 7 | 23 |
Prince Edward Island
| Technology | 2019 | 2030 | 2050 |
|---|---|---|---|
| Hydro | 0 | 0 | 0 |
| Natural Gas | 0 | 0 | 0 |
| Natural Gas CCS | 0 | 0 | 0 |
| Nuclear | 0 | 0 | 0 |
| Other Fossil | 0 | 0 | 0 |
| Solar | 0 | 15 | 11 |
| Wind | 100 | 85 | 89 |
Saskatchewan
| Technology | 2019 | 2030 | 2050 |
|---|---|---|---|
| Hydro | 15 | 10 | 5 |
| Natural Gas | 40 | 22 | 2 |
| Natural Gas CCS | 0 | 2 | 10 |
| Nuclear | 0 | 0 | 0 |
| Other Fossil | 41 | 0 | 0 |
| Solar | 0 | 11 | 20 |
| Wind | 3 | 55 | 62 |
Figure ES.7 shows the generation mix for each province in the main net-zero electricity scenario. In British Columbia (B.C.), Manitoba, Quebec, and Newfoundland and Labrador, electricity generation continues to be primarily hydropower. Nuclear power remains limited to Ontario and New Brunswick and represents about 41% and 24%, respectively, of those provinces’ electricity supply in 2050.
Natural gas-fired electricity generation remains a relatively important share, about 15%, of the electricity supply of Alberta and Saskatchewan in the main net-zero electricity scenario. However, by 2050, the vast majority of this generation utilizes CCS technology. In many other provinces, although the generation share is small, natural gas units nonetheless provide flexible capacity required to maintain system reliability.
Transmission between provinces is a key factor that enables the electricity system to reach net-zero. For example, in the Base net-zero electricity scenario, increased transmission occurs in western Canada, where hydroelectric generation from B.C. and Manitoba helps Alberta and Saskatchewan decarbonize.
While we continue to see diversity between the various provincial electricity systems in each net-zero electricity scenario, results vary somewhat between cases. In a scenario where transmission expansions are limited, Alberta and Saskatchewan use more generation from natural gas with CCS. By contrast, in the Higher Carbon Price scenario, natural gas with CCS is lower in these provinces as small modular reactors make inroads in western Canada. Meanwhile, in the Hydrogen scenario there is a 26% reduction of all types of natural gas-fired generation relative to the main net-zero electricity scenario in 2050, and the flexible nature of hydrogen-fired generation means battery storage falls by 32%. In the Bioenergy with CCS (BECCS) scenario, the availability of biomass CCS units for electricity generation partially displaces all other generation technologies in Alberta and Saskatchewan. Due to the carbon removal capability of biomass CCS, the electricity system in Canada becomes a net negative emissions economic sector in the BECCS scenario.
Crude Oil Production
5. In the Evolving Policies Scenario, crude oil production grows much more slowly than in the past decade, rising 16% to a peak of 5.8 MMb/d in 2032. Afterwards, production declines slowly to 2050. As crude oil available for export from western Canada increases over the next decade , it comes close to filling the level of total export capacity that would be provided by existing pipeline capacity, planned pipeline expansions, and structural rail.
Figure ES.8: Crude Oil Production, Evolving and Current Policies Scenarios

Click to enlarge
Figure ES.9: Oil sands Production from Currently Producing Facilities, Expanded, and New Facilities, Evolving Policies Scenario

Click to enlarge
Figure ES.8 Description
Description: This graph shows crude oil production by type from 2005 to 2050 in the Evolving Policies Scenario, and total production for the Current Policies Scenario. Canadian crude oil production in the Evolving Policies Scenario peaks at 5.8 million barrels per day (MMb/d) (922 10³m³/d) in 2032 and declines to 4.7 MMb/d (756 10³m³/d) in 2050, an increase of 2% from 2020. For comparison, production peaks at 6.7 MMb/d (1 064 10³m³/d) in 2044 in the Current Policies Scenario.
Figure ES.9 Description
Description: This graph shows oil sands production from 2010 to 2050 for the following categories: new, expansion, and existing. Existing production is 3 million barrels per day (MMb/d) in 2020, 3.4 MMb/d by 2035, and 3 MMb/d by 2050. Production from expansion increases from 3 thousand barrels per (Mb/d) day in 2022 to 285 Mb/d by 2035, and 231 Mb/d by 2050. Greenfield production increases from 29 Mb/d in 2026 to 132 Mb/d by 2035, and 114 Mb/d by 2050.
Canadian crude oilDefinition * production recovered to pre-pandemic levels by late 2020, after steep reductions in the spring of 2020. In both scenarios, production increases in the near term, but long-term trends differ significantly based on scenario assumptions, such as future price levels and domestic climate policy.
In the Evolving Policies Scenario, Canadian production growth slows over the next decade peaking at 5.8 million barrels per day (MMb/d) in 2032, up from 5.0 MMb/d in 2021 (Figure ES.8). After 2032, production declines steadily, reaching 4.8 MMb/d in 2050. In the Evolving Policies Scenario, the assumed Brent crude oilDefinition * price gradually falls from an annual average of US$68 per barrel in 2021 to US$40 per barrel in 2050 (2020 dollars, adjusted for inflation).
Canadian crude oil production levels are resilient through to 2050 despite the Evolving Policies Scenario’s relatively low prices and steadily more ambitious climate policies. This largely stems from the nature of the oil sandsDefinition * facilities, which are long-lived and have low operating costs once built. Throughout the projection period, the vast majority of oil sands production is from facilities that are producing today (Figure ES.9).
Future global climate policy, and how it affects global crude oil markets, will be important for Canadian production. The Current Policies Scenario assumes higher global oil prices than the Evolving Policies Scenario, premised on there being higher global oil demand. The Brent crude oil price stays at US$70 per barrel through much of the projection period and Canadian production increases more rapidly, plateauing in 2040 at 6.7 MMb/d. Conversely, some recent global net-zero scenarios, such as the International Energy Agency’s Net Zero Emissions by 2050 scenario in World Energy Outlook 2021, show rapidly declining global oil demand, which could lead to significantly lower Canadian production levels compared to the Evolving Policies Scenario.
Figure ES.10: Illustrative Export Capacity from Pipelines and Structural Rail, vs. Total Crude Oil Supply Available from the Western Canadian Sedimentary Basin (WCSB), Evolving and Current Policies Scenarios

Description
Description: This chart shows illustrative export capacity from pipelines and structural rail versus total crude oil supply available from the Western Canadian Sedimentary Basin (WCSB), for the Evolving and Current Policies Scenarios. Pipeline and structural rail capacity grows from 2.9 million barrels per day (MMb/d) in 2010 to 5.3 MMb/d in 2050. In the Evolving Policies Scenario, crude oil available for export grows from 4 MMb/d in 2020 to a projected 4.9 MMb/d in 2035 before declining to 4.3 MMb/d by 2050. In the Current Policies Scenario, crude oil available for export grows from 4.0 MMb/d in 2020 to a projected 5.8 MMb/d in 2035 where it stays until 2050.
A key issue for Canadian oil pricing and production trends over the last number of years was the availability of crude oil export pipeline and rail capacity. In the Evolving Policies Scenario, crude oil available for export from western Canada comes very close to, but stays slightly below the illustrative total export capacity provided by existing plus planned pipeline capacity and structural rail, as shown in Figure ES.10. EF2021 does not assess whether additional pipeline capacity would be required to avoid constraining Canadian crude oil production below levels projected in the Evolving Policies Scenario. In the Current Policies Scenario, however, production would clearly be constrained below projected levels without additional pipeline capacity, as supply significantly exceeds the illustrative total export capacity through much of the projection period. Our crude oil supply projections are not adjusted to reflect potential pipeline constraints in either scenario.
Crude Oil Pipelines in Canada’s Energy Future
The Canada’s Energy Future series makes projections of energy production and use in Canada. To develop these projections, we need to make assumptions about crude oil markets. Figure ES.10 is an illustrative comparison of our crude oil supply projections with the level of total export capacity that would be provided if planned pipeline expansions go ahead, existing pipelines otherwise experience no increases or decreases in capacity, and a consistent level of structural rail exports continues.
Making this comparison provides insight into whether pipeline constraints might impact crude oil production in our scenarios. However, we do not adjust our crude oil production projections based on potential constraints. EF2021 does not explore the complexities of how pipeline infrastructure interacts with energy supply and demand outcomes. Instead, EF2021 assumes that western Canadian crude oil prices will consistently track prices in international markets. In reality, this is not always the case. For example, if the pipeline system is very full–where export volumes are above or only slightly below total pipeline capacity–crude prices in western Canada can fall well below prices in international markets.
Sufficient spare pipeline capacity is generally required for western Canadian prices to consistently track prices in international markets. Spare capacity provides oil producers and others in the marketplace with flexibility to access higher value markets, and avoid the impacts of maintenance, unforeseen outages, and higher cost rail. This flexibility would remain even with excess capacity and long-term underutilization of pipelines, though this could result in higher pipeline tolls, which could lead to some consistent incremental discounting of western Canadian crude prices. Analysis of these considerations is beyond the scope of EF2021. We caution readers from drawing definitive conclusions from the illustrative comparison shown Figure ES.10.
Natural Gas Production
6. Investment in natural gas production is spurred by assumed liquefied natural gas (LNG) exports in both scenarios. In the Evolving Policies Scenario, nearly 40% of Canadian natural gas production is liquefied and exported to global markets by 2050. Despite considerable LNG-related production growth, natural gas production remains relatively stable through much of the projection period before declining gradually to reach 13.1 Bcf/d by 2050, 17% lower than current levels.
Figure ES.11: Total Natural Gas Production and LNG Export Assumptions, Evolving and Current Policies Scenarios

Description
Description: This graph shows total natural gas production and liquified natural gas exports for the Evolving Policies and Current Policies scenarios from 2000 to 2050. Current Policies total production increases from 15 billion cubic feet (bcf) in 2015 to 22 bcf in 2050. Evolving Policies total production decreases from 15 bcf in 2015 to 13.1 bcf in 2050. Current Policies liquified natural gas exports increase from 0.3 bcf in 2024 to 7.1 bcf in 2050. Evolving Policies liquified natural gas exports increase from 0.3 bcf in 2024 to 4.9 bcf in 2050.
In the Evolving Policies Scenario, natural gas production remains near current levels of approximately 15.5 billion cubic feet per day (Bcf/d) through much of the next two decades. We assume that LNGDefinition * exports grow over that period, starting with 1.8 Bcf/d by 2026 and reaching 4.9 Bcf/d by 2039 in the Evolving Policies Scenario. The additional investment in production to feed these LNG exports sustains overall production levels. Without LNG, production would otherwise decline given the assumed natural gas prices and the costs associated with assumed domestic climate policies. After 2040, with LNG exports assumed to stay flat, total production begins to decline, falling to 13.1 Bcf/d by 2050. Assumed Henry HubDefinition * natural gas prices in the Evolving Policies Scenario steadily increase from US$3.00 per Million British Thermal Units (MMBtu) in 2021 to US$3.64/MMBtu by 2050 (2020 dollars, adjusted for inflation).
In the Current Policies Scenario, natural gas production is significantly higher. To reflect higher global and North American demand for natural gas due to the scenario’s lower climate action, we assume LNG exports increase to 7.1 Bcf/d by 2044 and the Henry Hub price reaches $4.40/MMBtu by 2050 (2020 dollars, adjusted for inflation). These two drivers, combined with less stringent domestic climate policies relative to the Evolving Policies Scenario, lead to natural gas production increasing steadily throughout the projection, reaching 22.2 Bcf/d in 2050, a 40% increase from 2021 production levels.
Figure ES.12: Natural Gas Production, Evolving and Current Policies Scenarios

Description
Description: This graph shows natural gas production by type from 2005 to 2050 in the Evolving Policies Scenario, and total natural gas production for the Current Policies Scenario. Total production in 2015 was 15.1 billion cubic feet per day (Bcf/d), with tight and shale gas production at 9.7 Bcf/d in the Evolving Policies Scenario. In 2050, total gas production is 13.1 Bcf/d in the Evolving Policies Scenario, with tight and shale gas making up the majority of production at 12.4 Bcf/d. In the Current Policies Scenario, total production increases to 22.2 Bcf/d by 2050.
In both scenarios, natural gas production from the Montney Formation, which straddles the Alberta-British Columbia boundary and is rich in higher value natural gas liquidsDefinition *, grows significantly. In many other regions, production is stable or declines throughout the projection. Much of the production growth related to LNG exports occurs in B.C. and production in B.C. surpasses that of Alberta by 2028.
Fossil Fuel Demand
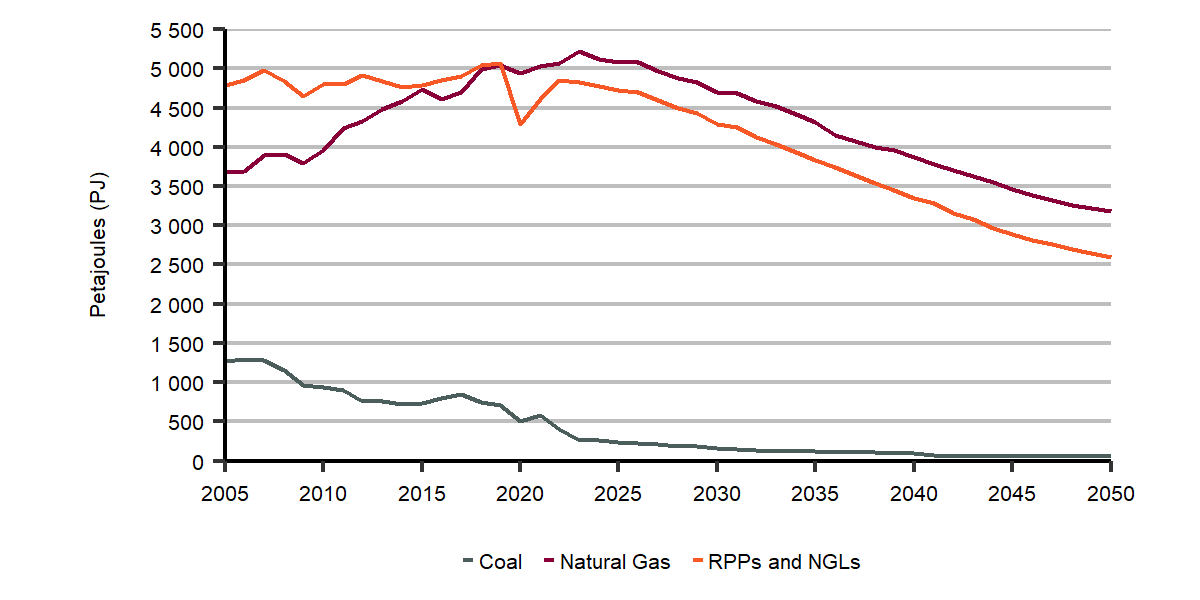
7. As Canada’s energy system decarbonizes in the Evolving Policies Scenario, we use less fossil fuels. Coal becomes a negligible part of the energy mix. Use of oil-derived fuels declines, especially gasoline and diesel for transportation. After briefly rising in the near term, total natural gas use declines, and our consumption of natural gas is increasingly tied to the future of CCS. Natural gas with CCS for industrial uses, power generation, and hydrogen production are key demand growth areas.
Figure ES.13: Fossil Fuel Demand by Type, Evolving Policies Scenario
Click to enlarge
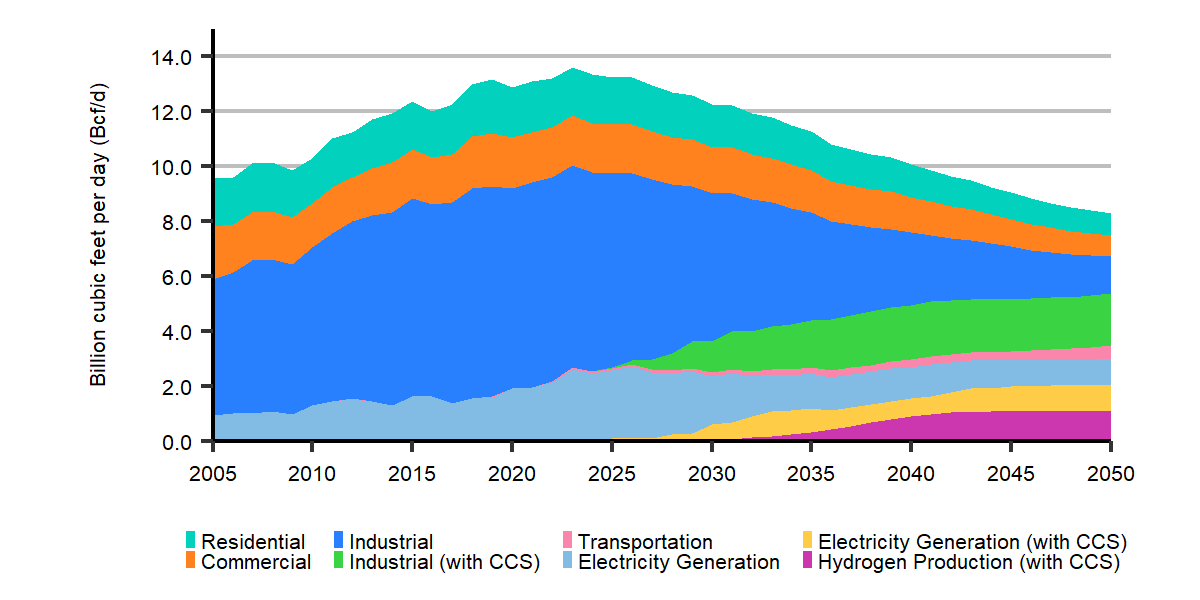
Figure ES.14: Natural Gas Demand by Sector, Evolving Policies Scenario
Click to enlarge
Figure ES.13 Description
Description: This chart breaks down fossil demands by fuel over the projection period for the Evolving Policies Scenario. Coal demand declines from 503 Petajoules (PJ) in 2020 to 58 PJ in 2050. Refined petroleum product (RPP) and natural gas liquids (NGL) demands decline from 4 290 PJ in 2020 to 2 619 PJ in 2050. Natural gas demands decline from 4 940 PJ in 2020 to 3 189 PJ in 2050. Total fossil fuel demand in the Evolving Policies Scenario declines from 10 774 PJ in 2018 to 5 867 PJ in 2050.
Figure ES.14 Description
Description: This chart breaks down total natural gas demand by sector for the Evolving Policies Scenario. Residential demand is 1.8 billion cubic feet per day (bcf/d) in 2020, 1.4 bcf/d by 2035, and 0.8 bcf/d by 2050. Industrial demand is 7.3 bcf/d in 2020, 3.8 bcf/d by 2035, and 1.4 bcf/d by 2050. Transportation demand is 0.0 bcf/d in 2020, 0.2 bcf/d by 2035, and 0.5 bcf/d by 2050. Commercial demand is 1.9 bcf/d in 2020, 1.5 bcf/d by 2035, and 0.8 bcf/d by 2050. Electricity generation demand is 1.9 bcf/d in 2020, 1.3 bcf/d by 2035, and 1.0 bcf/d by 2050. Industrial with CCS demand is 0 bcf/d in 2020, 1.7 bcf/d by 2035, and 1.9 bcf/d by 2050. Electricity generation with CCS is 0 bcf/d in 2020, 0.9 bcf/d by 2035, and 0.9 bcf/d by 2050. Hydrogen production with CCS demand is 0 bcf/d in 2020, 0.3 bcf/d by 2035, and 1.1 bcf/d by 2050.
In the Evolving Policies Scenario, total Canadian fossil fuel use declines over 40% from 2021 to 2050. However, projections differ across the various fossil fuels. Canadian demand for natural gas has seen relatively strong growth over the last decade, driven by increased use in the oil sands and power generation as coal was phased out. In the Evolving Policies Scenario, gas demand grows over the next two years, as Alberta electricity producers aim to no longer use coal for electricity generation by 2023. Over the longer term, although natural gas remains an important part of Canada’s energy mix, total demand declines from around 13 Bcf/d in 2021 to 8.5 Bcf/d in 2050. Factors that reduce natural gas demand include: increasing use of renewables in power generation, renewable natural gas and hydrogen blended into gas streams, energy efficiency improvements, and declining crude oil and natural gas production (which itself requires natural gas). These declines are partially offset by applying CCS technology when using natural gas in industry, the power sector and to produce low-carbon hydrogen.
Coal consumption declines significantly over the projection, driven by its phase out from electricity generation. Coal drops to less than 1% of Canada’s energy mix by 2035, compared to 5% in 2019. Use of refined petroleum products (RPPs)Definition * and NGLs gradually falls throughout most of the projection period, driven by declines in gasoline and diesel fuel demand. In the earlier years, this fall is driven by fuel efficiency improvements and increased blending of biofuels, and in the long term by increased use of electric and hydrogen vehicles in transportation. Demand for RPPs used for non-combustion purposes (petrochemical feedstocks, asphalt, lubricants, etc.), as well as for aviation fuel, is relatively steady throughout the projection.
- Date modified: